
Aperçu
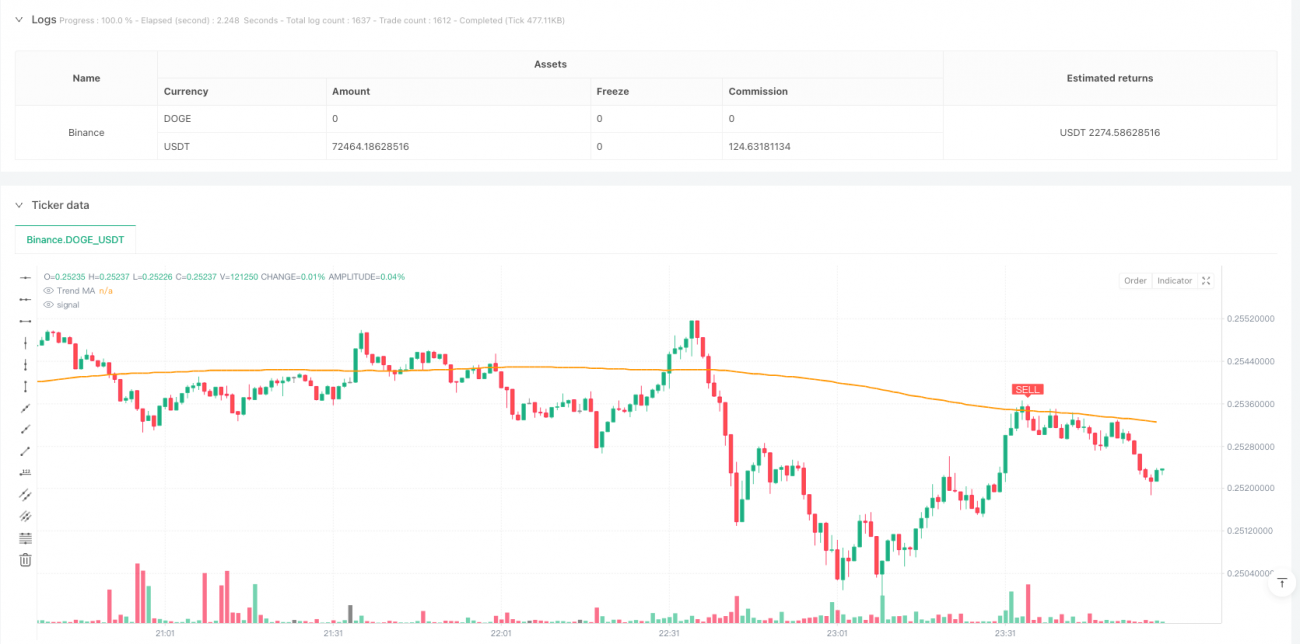
Cette stratégie est un système de trading à double filtrage combinant le RSI (indicateur relativement faible) et la courbe de tendance. La stratégie se déroule au niveau de la courbe solaire, en combinant le signal de surachat et de survente du RSI avec la courbe de tendance à long terme. Le cœur de la stratégie est d'ajouter un filtre de tendance sur la base du signal de trading RSI traditionnel pour améliorer l'exactitude et la fiabilité des transactions.
Principe de stratégie
La stratégie repose principalement sur les composants clés suivants:
- L'indicateur RSI est utilisé pour identifier les zones de sur-achat et de survente, avec un paramètre par défaut de 14 cycles
- Le niveau de survente est fixé à 70 et le niveau de survente à 30.
- La moyenne mobile simple à 200 cycles comme filtre de tendance
- Conditions d'achat: le RSI est en hausse depuis la zone de survente et le prix est au-dessus de la moyenne
- Conditions de vente: le RSI a dépassé la zone de survente et le prix est en dessous de la moyenne
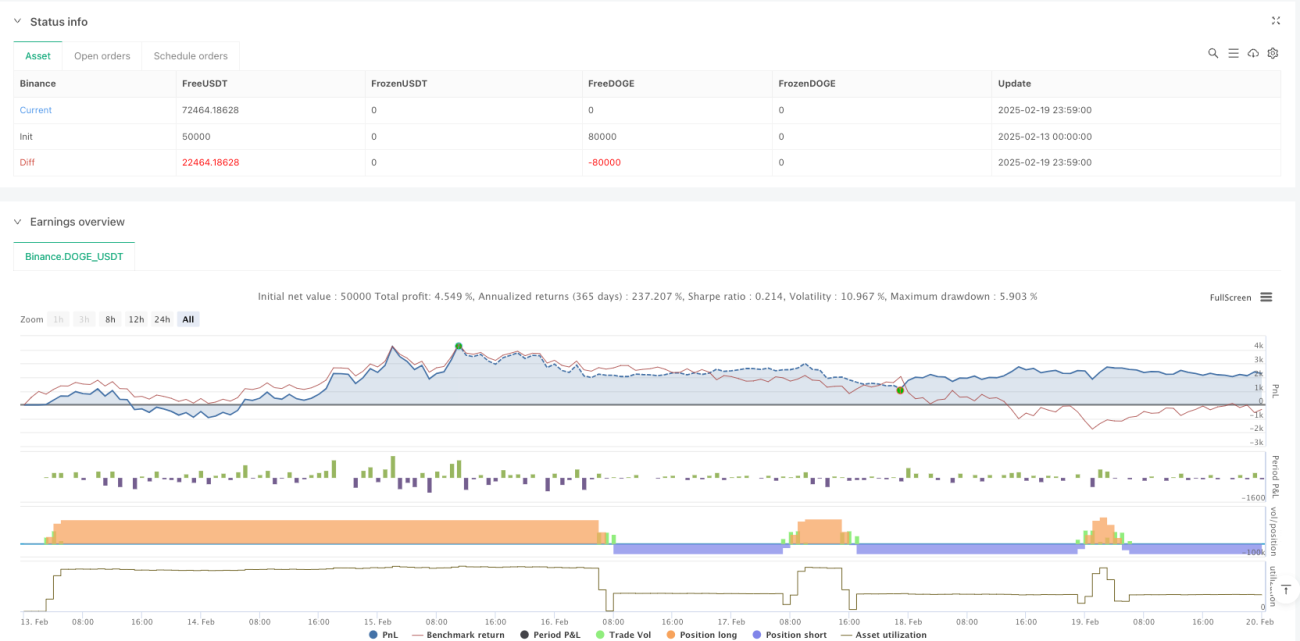
Les stratégies exécutent automatiquement les transactions à chaque signal et peuvent être configurées avec des rappels.
Avantages stratégiques
- Le mécanisme de double confirmation améliore considérablement la fiabilité des transactions
- Combinaison de tendances et de dynamiques pour réduire le risque de faux signaux
- Système d'exécution de transactions entièrement automatisé
- La flexibilité des paramètres permet d'optimiser la stratégie
- Alerte intégrée en temps réel pour une utilisation pratique
- L'interface visuelle affiche clairement les signaux de transaction
- Prise en charge de la rétroaction pour faciliter la vérification de la stratégie
Risque stratégique
- Les marchés en crise peuvent générer des signaux de trading fréquents
- Le point de basculement de la tendance pourrait être retardé
- Des paramètres incorrects peuvent affecter les performances de la stratégie
- Une forte volatilité du marché pourrait entraîner un retrait plus important.
Il est recommandé de gérer les risques de la manière suivante:
- Réalisez une position de stop loss raisonnable
- Ajustement approprié de la taille de la position
- Optimiser régulièrement les paramètres de stratégie
- En combinaison avec d'autres indicateurs techniques
Orientation de l'optimisation de la stratégie
- Augmentation des filtres de volatilité et ajustement des critères de négociation pendant les périodes de forte volatilité
- Introduction d'un mécanisme d'adaptation des paramètres, permettant une adaptation dynamique des paramètres en fonction des conditions du marché
- Ajoutez un mécanisme de confirmation du volume pour améliorer la fiabilité du signal
- Développer des mécanismes de sortie plus sophistiqués pour optimiser les échéances
- L'intégration d'analyses à cycles multiples fournit une vision plus complète du marché
Résumer
La stratégie, combinée au RSI et à la courbe de tendance, construit un système de négociation stable. La stratégie est conçue de manière rationnelle, les règles d'opération sont claires et ont une bonne utilité. Grâce à une gestion raisonnable des risques et une optimisation continue, la stratégie est susceptible de générer des rendements stables dans les transactions réelles.
/*backtest
start: 2025-02-13 00:00:00
end: 2025-02-20 00:00:00
period: 1m
basePeriod: 1m
exchanges: [{"eid":"Binance","currency":"DOGE_USDT"}]
*/

//@version=5
strategy("Leading Indicator Strategy – Daily Signals", overlay=true,
     pyramiding=1, initial_capital=100000,
default_qty_type=strategy.percent_of_equity, default_qty_value=100)- 1