Aperçu
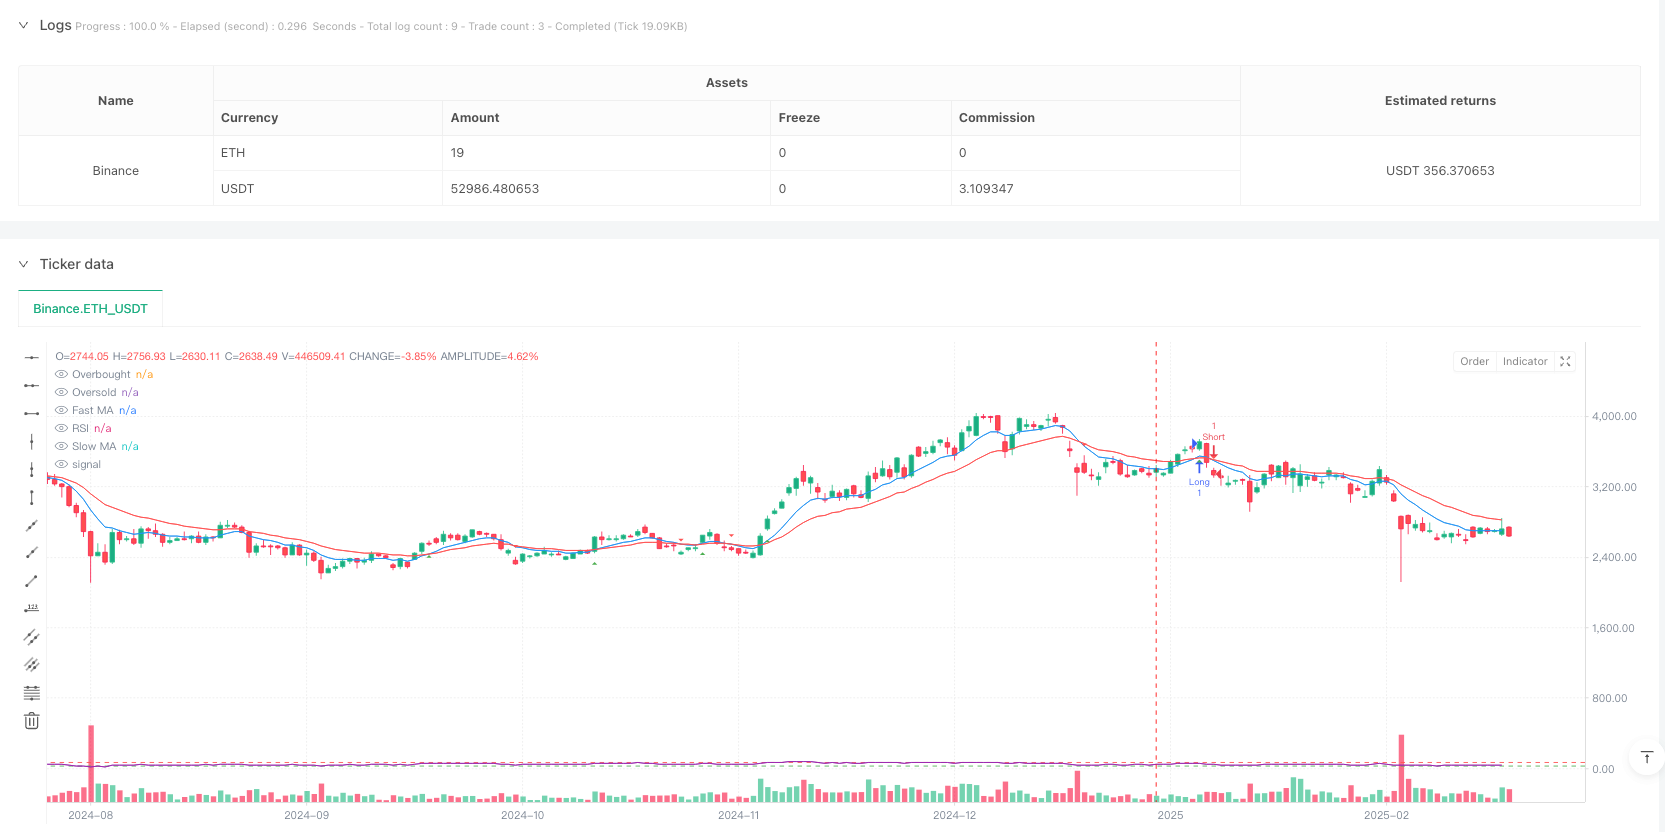
La stratégie est un système de négociation qui combine un croisement bi-homogène et un indicateur relativement faible (RSI). La stratégie utilise les moyennes mobiles indicielles à 9 cycles et à 21 cycles (EMA) comme principal outil de génération de signaux, tout en introduisant l’indicateur RSI comme filtre pour éviter de négocier dans des zones d’excès d’achat/vente. Cette approche combinée conserve à la fois les caractéristiques du suivi de la tendance et ajoute une dimension de confirmation de la dynamique.
Principe de stratégie
La logique fondamentale de la stratégie repose sur les éléments clés suivants :
- Un signal croisé entre une EMA rapide (de 9 cycles) et une EMA lente (de 21 cycles)
- L’indicateur RSI ((14 cycles) sert de filtre, définissant 70 et 30 comme seuils d’achat et de vente excessifs
- Conditions d’achat: EMA rapide sur une EMA lente et un RSI inférieur à 70
- Conditions de vente: EMA rapide à travers EMA lente avec RSI supérieur à 30 La stratégie consiste à éviter de négocier en période de surchauffe ou de surchauffe du marché tout en garantissant la fiabilité des signaux de tendance.
Avantages stratégiques
- Fiabilité du signal: amélioration de la fiabilité des signaux de négociation par la combinaison d’un indicateur en deux dimensions de tendance et de dynamique
- Contrôle des risques: le filtre RSI évite efficacement les transactions dans les zones d’achat/vente excessives
- Adaptabilité: les paramètres de la stratégie peuvent être ajustés en fonction des différentes conditions du marché
- Automatisation élevée: fonctionnalités complètes de génération de signaux et de rappels
- Une bonne visualisation: offre une interface graphique claire pour aider les traders à comprendre l’état du marché
Risque stratégique
- Risque de retard: les moyennes mobiles sont essentiellement des indicateurs retardés, ce qui peut entraîner des retards dans les marchés à forte volatilité
- Risque de fausse rupture: des signaux de fausse rupture fréquents peuvent survenir dans les marchés de gré à gré
- Sensitivité des paramètres: les effets de la stratégie sont sensibles aux paramètres, et différentes combinaisons de paramètres peuvent être nécessaires dans différents environnements de marché
- Dépendance aux conditions du marché: meilleure performance dans les marchés en forte tendance, mais peut-être moins bonne dans les marchés en turbulence
Orientation de l’optimisation de la stratégie
- Introduction d’indicateurs de volatilité: envisagez d’ajouter l’ATR ou les bandes de Bollinger pour s’adapter à différents environnements de fluctuation du marché
- Optimisation du filtrage des signaux: inclusion d’indicateurs de volume de transaction comme confirmation auxiliaire
- Ajustement dynamique des paramètres: développement d’un système de paramètres adaptatifs qui ajuste automatiquement les paramètres de l’indicateur en fonction des conditions du marché
- Augmentation des mécanismes d’arrêt des pertes: ajout d’une fonction d’arrêt dynamique et amélioration de la capacité de gestion des risques
- Optimisation des délais: analyse des délais multiples pour améliorer la fiabilité du signal
Résumer
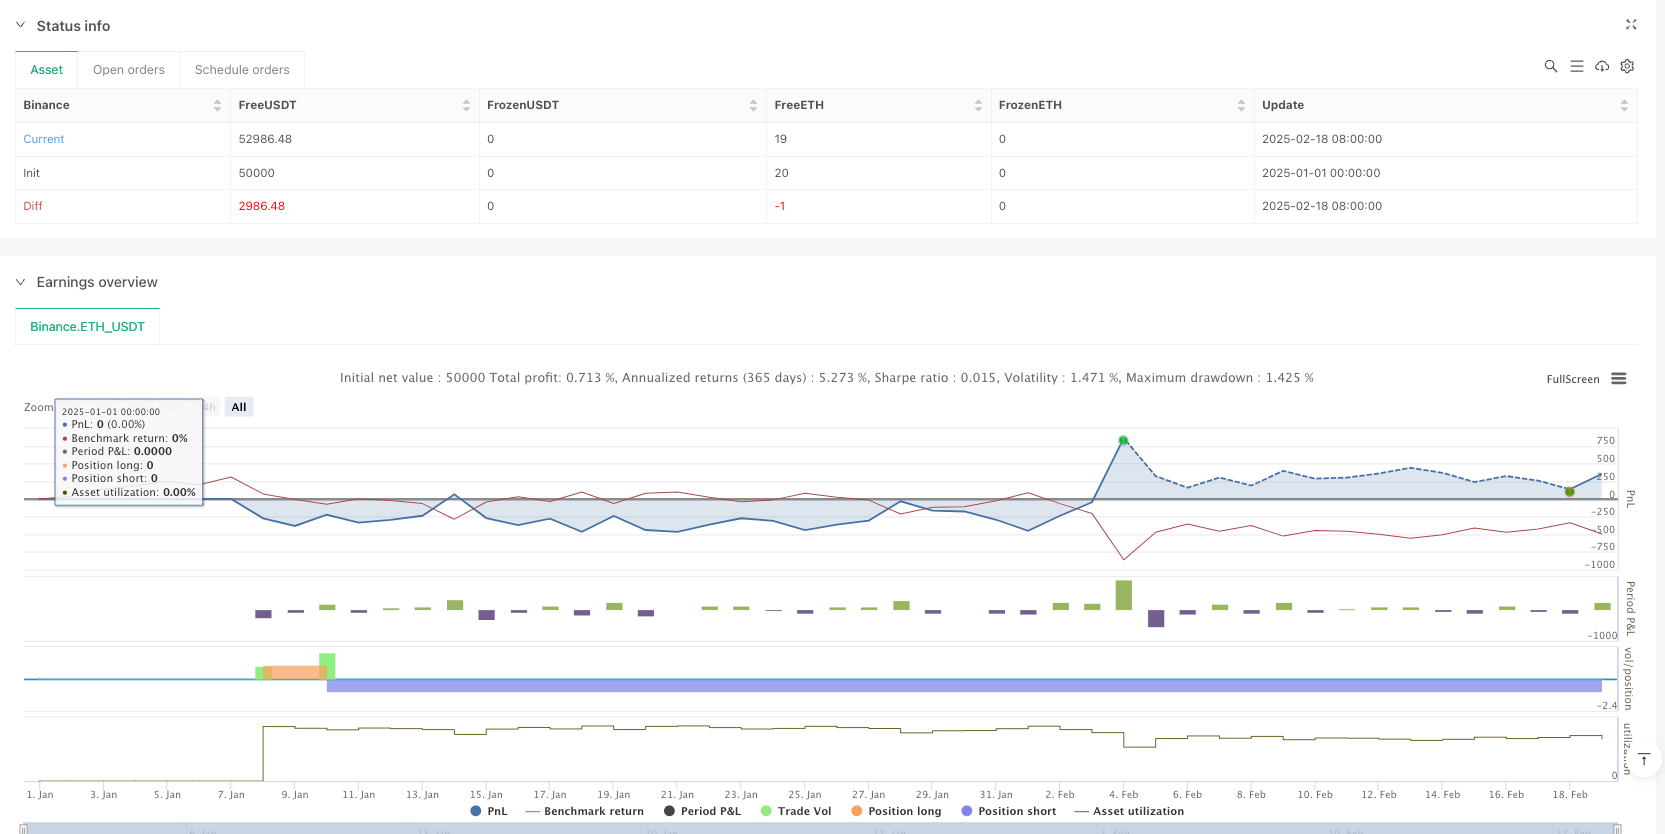
La stratégie est basée sur une combinaison organique de suivi de la tendance et de confirmation de la dynamique. Les principaux avantages de la stratégie résident dans sa fiabilité et sa capacité à contrôler les risques, mais il faut également tenir compte du retard des moyennes mobiles et de la sensibilité des paramètres.
/*backtest
start: 2025-01-01 00:00:00
end: 2025-02-19 08:00:00
period: 1d
basePeriod: 1d
exchanges: [{"eid":"Binance","currency":"ETH_USDT"}]
*/

// This Pine Script™ code is subject to the terms of the Mozilla Public License 2.0 at https://mozilla.org/MPL/2.0/
// © McTunT

// Gold Price Trading Signals
// Pine Script version 6 code for TradingView
//@version=6
strategy("Ausiris Gold Trading Strategy", overlay=true)

// Input parameters
fastLength = input.int(9, title="Fast MA Length", minval=1)
slowLength = input.int(21, title="Slow MA Length", minval=1)
rsiLength = input.int(14, title="RSI Length", minval=1)
rsiOverbought = input.int(70, title="RSI Overbought Level", minval=50, maxval=100)
rsiOversold = input.int(30, title="RSI Oversold Level", minval=0, maxval=50)

// Calculate moving averages
fastMA = ta.ema(close, fastLength)
slowMA = ta.ema(close, slowLength)

// Calculate RSI
rsiValue = ta.rsi(close, rsiLength)

// Plot moving averages
plot(fastMA, color=color.blue, title="Fast MA")
plot(slowMA, color=color.red, title="Slow MA")

// Generate signals
longCondition = ta.crossover(fastMA, slowMA) and rsiValue < rsiOverbought
shortCondition = ta.crossunder(fastMA, slowMA) and rsiValue > rsiOversold

// Plot buy/sell signals
plotshape(longCondition, title="Buy Signal", location=location.belowbar, color=color.green, style=shape.triangleup, size=size.small)
plotshape(shortCondition, title="Sell Signal", location=location.abovebar, color=color.red, style=shape.triangledown, size=size.small)

// Strategy entry/exit
if (longCondition)
    strategy.entry("Long", strategy.long)
if (shortCondition)
    strategy.entry("Short", strategy.short)

// Add alert conditions
alertcondition(longCondition, title="Buy Alert", message="Gold Buy Signal!")
alertcondition(shortCondition, title="Sell Alert", message="Gold Sell Signal!")

// Display RSI values
hline(rsiOverbought, "Overbought", color=color.red)
hline(rsiOversold, "Oversold", color=color.green)
plot(rsiValue, "RSI", color=color.purple, display=display.none)