Aperçu
Il s’agit d’une stratégie de suivi de tendance basée sur l’indicateur ATR (Average True Range), combinant un stop dynamique et un signal de croisement de ligne moyenne. La stratégie détermine la volatilité du marché en calculant l’ATR et utilise cette information pour établir un stop dynamique.
Principe de stratégie
La logique centrale de la stratégie est basée sur les calculs clés suivants:
- Utilisation de l’indicateur ATR pour mesurer la volatilité du marché, avec une régulation périodique
- Distance d’arrêt dynamique calculée sur la valeur ATR, ajustée par le paramètre de sensibilité a
- Construction d’une ligne de suivi ATR qui s’ajuste dynamiquement au mouvement des prix
- Utilisez une EMA de 1 cycle et un croisement de l’ATR suivant la ligne de stop-loss pour déterminer le signal de transaction
- L’EMA est libre en cas de rupture de la ligne de traçabilité ATR vers le haut et libre en cas de rupture vers le bas
- Le prix de clôture ordinaire ou le prix HLC3 de la ligne K de Pyongyang peut être utilisé comme référence de calcul.
Avantages stratégiques
- Adaptabilité dynamique: ATR tracking stop loss s’ajuste automatiquement en fonction de la volatilité du marché, ce qui permet à la stratégie de rester stable dans différents environnements de marché
- Contrôle des risques: protection continue des positions grâce à une ligne stop-loss dynamique
- Paramètres bien réglables: ils peuvent s’adapter à différentes caractéristiques du marché en ajustant le cycle et la sensibilité ATR
- Signal clair et fiable: la combinaison de la ligne de croix uniforme fournit un signal d’entrée et de sortie clair
- La logique de calcul est simple: la logique de stratégie est claire, facile à comprendre et à maintenir
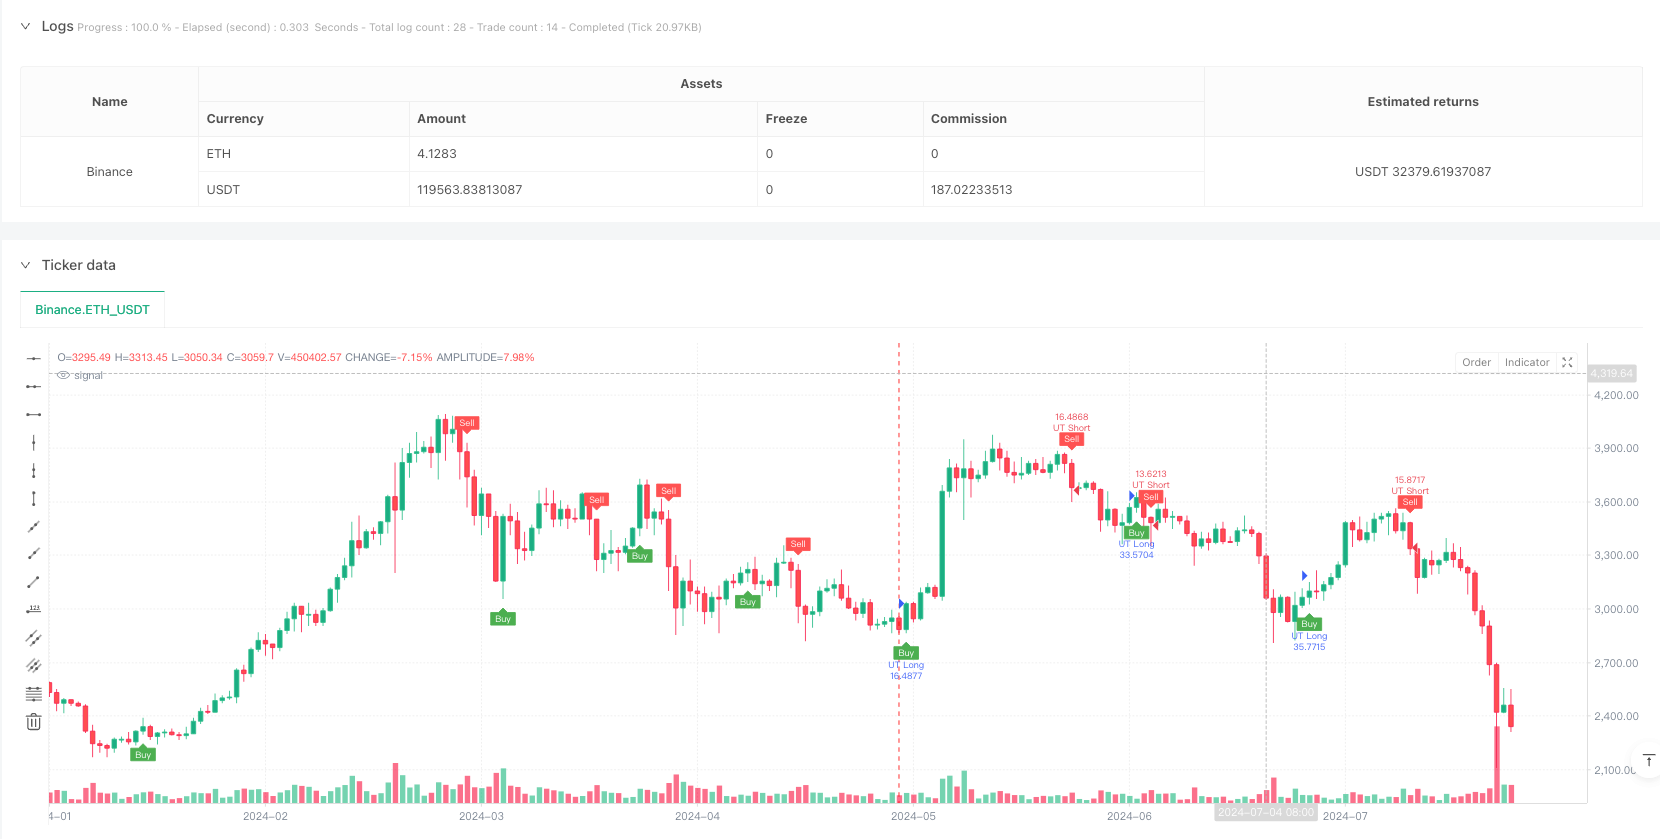
- Une bonne visualisation: un affichage graphique des signaux de trading et des tendances
Risque stratégique
- Risque de choc: les faux signaux de rupture peuvent être fréquents dans les marchés à choc horizontal.
- Effets des points de glissement: les points de glissement peuvent être plus importants dans des conditions rapides, ce qui affecte la performance de la stratégie
- Sensibilité des paramètres : différentes combinaisons de paramètres peuvent entraîner de grandes différences dans les performances de la stratégie
- Dépendance à la tendance : la stratégie peut ne pas être performante sur des marchés sans tendance
- Ampleur de stop loss: une anomalie de l’ATR peut entraîner une position de stop loss déraisonnable
Orientation de l’optimisation de la stratégie
- Augmentation des filtres de tendance: introduire des indicateurs de jugement de tendance supplémentaires pour réduire les faux signaux sur les marchés oscillants
- Adaptation des paramètres d’optimisation: développement d’un mécanisme d’optimisation automatique du cycle et de la sensibilité ATR
- Amélioration de la confirmation des signaux: augmentation du volume de transactions ou d’autres indicateurs techniques comme confirmation des signaux
- Amélioration des mécanismes de stop-loss: augmentation de la combinaison de stop-loss fixe et mobile sur la base de l’ATR
- Augmentation de la gestion des positions: ajustement de la taille des positions en fonction de la dynamique de volatilité du marché
Résumer
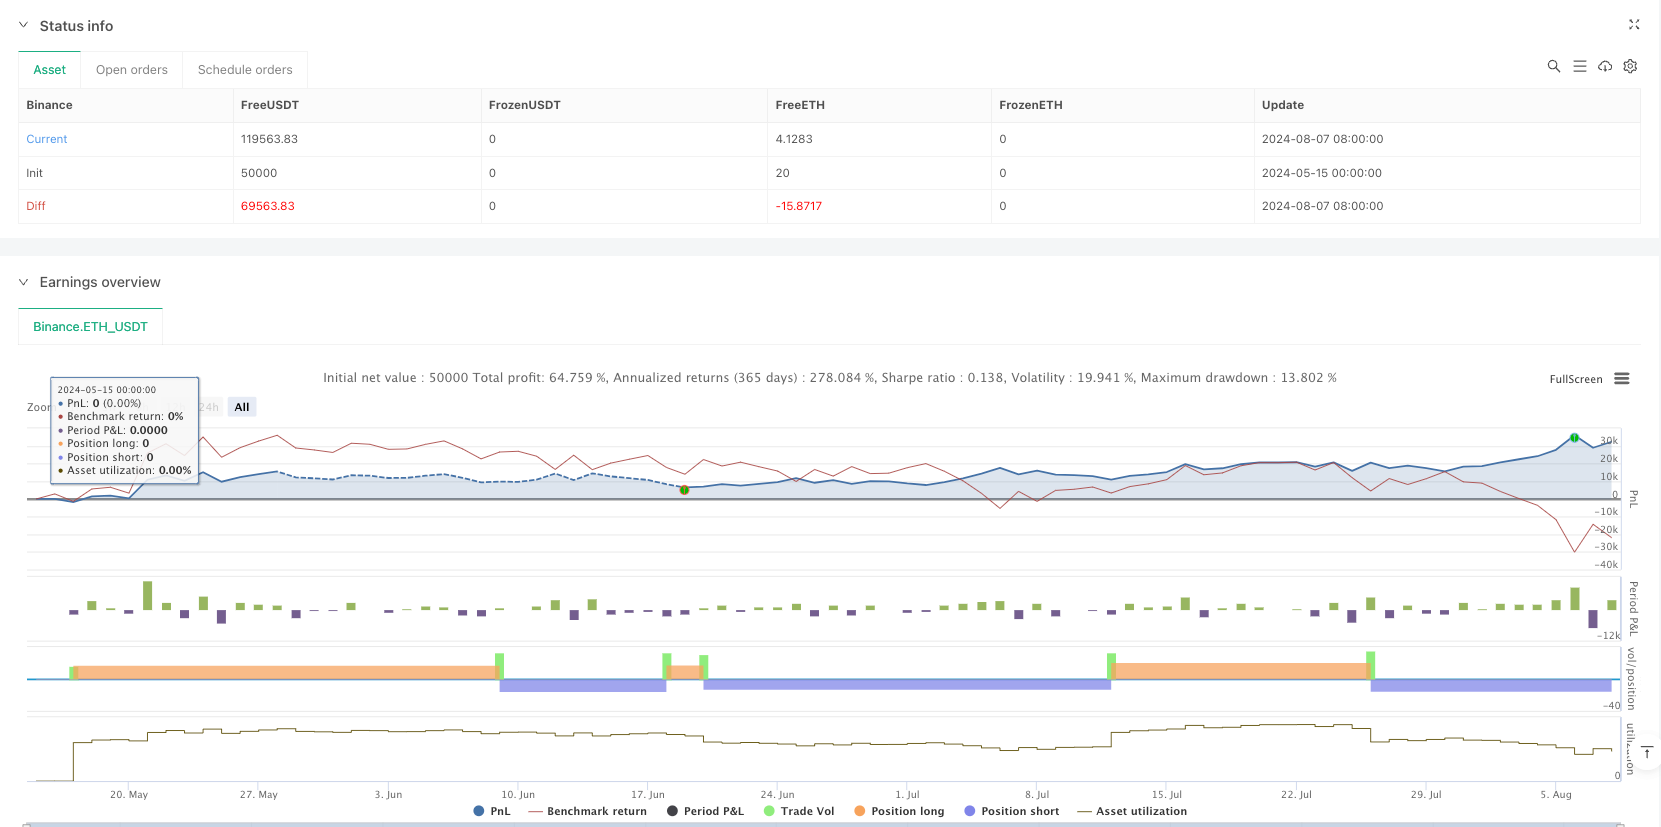
Il s’agit d’une stratégie de négociation complète qui combine le suivi dynamique des arrêts-pertes et du système de linéaire. La stratégie capte les caractéristiques de la volatilité du marché via les indicateurs ATR et fournit des signaux de négociation à l’aide de la croisée des linéaires, formant un système de négociation rigoureux. L’avantage de la stratégie réside dans son adaptabilité dynamique et sa capacité à contrôler les risques, mais il faut également prêter attention à la performance du marché horizontal.
/*backtest
start: 2024-05-15 00:00:00
end: 2024-08-08 00:00:00
period: 1d
basePeriod: 1d
exchanges: [{"eid":"Binance","currency":"ETH_USDT"}]
*/

//@version=6
strategy(title="UT Bot Strategy", overlay=true, default_qty_type=strategy.percent_of_equity, default_qty_value=100)

// Inputs
a = input.float(1, title="Key Value. 'This changes the sensitivity'")
c = input.int(10, title="ATR Period")
h = input.bool(false, title="Signals from Heikin Ashi Candles")

// Calculate ATR
xATR = ta.atr(c)
nLoss = a * xATR

// Source for calculations
src = h ? request.security(syminfo.tickerid, timeframe.period, hlc3) : close

// ATR Trailing Stop logic
var float xATRTrailingStop = na
if (not na(xATRTrailingStop[1]) and src > xATRTrailingStop[1] and src[1] > xATRTrailingStop[1])
    xATRTrailingStop := math.max(xATRTrailingStop[1], src - nLoss)
else if (not na(xATRTrailingStop[1]) and src < xATRTrailingStop[1] and src[1] < xATRTrailingStop[1])
    xATRTrailingStop := math.min(xATRTrailingStop[1], src + nLoss)
else
    xATRTrailingStop := src > xATRTrailingStop[1] ? src - nLoss : src + nLoss

// Position logic
var int pos = 0
if (not na(xATRTrailingStop[1]) and src[1] < xATRTrailingStop[1] and src > xATRTrailingStop[1])
    pos := 1
else if (not na(xATRTrailingStop[1]) and src[1] > xATRTrailingStop[1] and src < xATRTrailingStop[1])
    pos := -1
else
    pos := pos[1]

xcolor = pos == -1 ? color.red : pos == 1 ? color.green : color.blue

// Entry and Exit Signals
ema = ta.ema(src, 1)
above = ta.crossover(ema, xATRTrailingStop)
below = ta.crossover(xATRTrailingStop, ema)

buy = src > xATRTrailingStop and above
sell = src < xATRTrailingStop and below

// Strategy Execution
if (buy)
    strategy.entry("UT Long", strategy.long)
if (sell)
    strategy.entry("UT Short", strategy.short)

// Plotting and Alerts
plotshape(buy, title="Buy", text='Buy', style=shape.labelup, location=location.belowbar, color=color.green, textcolor=color.white, size=size.tiny)
plotshape(sell, title="Sell", text='Sell', style=shape.labeldown, location=location.abovebar, color=color.red, textcolor=color.white, size=size.tiny)

barcolor(src > xATRTrailingStop ? color.green : src < xATRTrailingStop ? color.red : na)

alertcondition(buy, title="UT Long", message="UT Long")
alertcondition(sell, title="UT Short", message="UT Short")