Stratégie de renversement de tendance à double momentum basée sur le RSI et le RSI stochastique

Aperçu
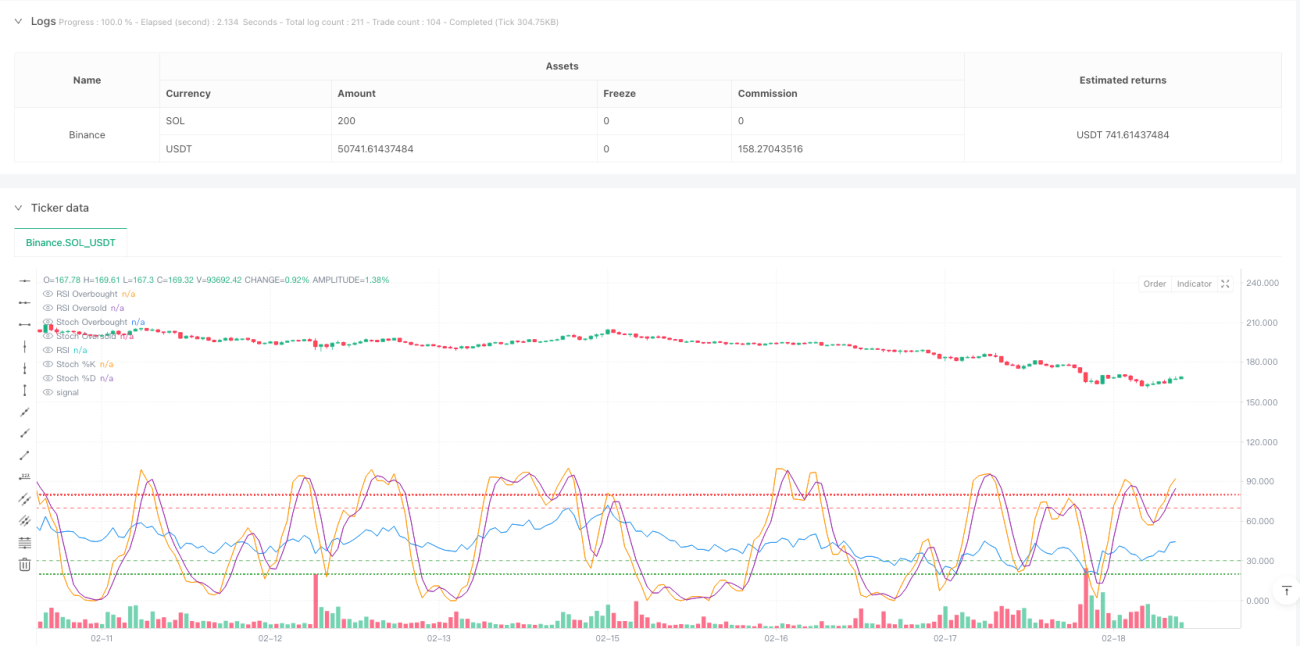
Il s'agit d'une stratégie de négociation de revers de tendance combinant un indicateur relativement faible (RSI) et un indicateur relativement faible (RSI stochastique) au hasard. Cette stratégie permet de capturer les revers potentiels en identifiant les conditions de survente et de survente du marché ainsi que les changements de dynamique. Le cœur de la stratégie consiste à utiliser le RSI comme indicateur de dynamique de base, puis à calculer le RSI stochastique sur cette base pour confirmer davantage la direction des changements de la dynamique des prix.
Principe de stratégie
La logique principale de la stratégie comprend les étapes clés suivantes:
- Comptez d'abord le RSI du cours de clôture pour déterminer si l'ensemble est sur-acheté ou sur-vendu
- Calcul des lignes %K et %D du RSI stochastique sur la base des valeurs du RSI
- Un signal de multiplication est déclenché lorsque le RSI est en zone de survente (default inférieur à 30) et que la ligne %K du RSI stochastique traverse la ligne %D de bas en haut
- Un signal de creux est déclenché lorsque le RSI est en zone de survente (default supérieur à 70) et que la ligne%K du RSI stochastique traverse la ligne%D de haut en bas
- Lorsque des conditions RSI opposées se produisent ou que le RSI stochastique est inversé, la position est levée et sortie.
Avantages stratégiques
- Mécanisme de double confirmation - utilisation en combinaison du RSI et du RSI stochastique pour réduire efficacement le risque de fausse rupture
- Paramètres personnalisables - les paramètres clés de la stratégie, tels que les cycles RSI, les seuils de surachat et de survente, peuvent être ajustés en fonction des conditions du marché
- Visualisation dynamique - la stratégie offre une présentation graphique en temps réel du RSI et du RSI stochastique pour faciliter la surveillance des traders
- Gestion intégrée des risques - avec un mécanisme complet de stop-loss et de profit-closure
- Adaptabilité - peut être appliqué à différents cycles de temps et environnements de marché
Risque stratégique
- Risques de choc - Faux signaux peuvent être fréquents dans les marchés à choc horizontal
- Risque de retard - le signal peut être retardé d'une certaine manière en raison de l'utilisation d'une mise au point de plusieurs lignes moyennes
- Sensitivité des paramètres - différents paramètres peuvent entraîner des résultats de transaction significativement différents
- Dépendance à l'environnement du marché - peut manquer une partie de l'activité dans un marché en forte tendance
- Gestion des risques - un ratio de détention raisonnable est nécessaire pour maîtriser les risques
Orientation de l'optimisation de la stratégie
- Ajout d'un filtre de tendance - les moyennes mobiles à long terme peuvent être ajoutées comme filtre de tendance, en ouvrant des positions uniquement dans la direction de la tendance
- Optimisation des mécanismes d'arrêt des pertes - l'introduction d'arrêts dynamiques tels que les arrêts de suivi ou les arrêts ATR
- Introduction d'indicateurs de trafic - l'analyse du trafic combiné peut améliorer la fiabilité du signal
- Ajout de filtres temporels - pour éviter les moments de presse critiques ou les périodes de faible mobilité
- Développer des paramètres d'adaptation - Ajuster automatiquement les paramètres de stratégie en fonction des fluctuations du marché
Résumer
Il s'agit d'une stratégie globale combinant dynamique et inversion de tendance, permettant d'identifier les opportunités de trading potentielles grâce à la synergie entre le RSI et le RSI stochastique. La stratégie est conçue de manière rationnelle, avec une meilleure ajustabilité et adaptabilité.
/*backtest
start: 2024-06-15 00:00:00
end: 2025-02-19 08:00:00
period: 1h
basePeriod: 1h
exchanges: [{"eid":"Binance","currency":"SOL_USDT"}]
*/

//@version=5
strategy("RSI + Stochastic RSI Strategy", overlay=true, initial_capital=100000, default_qty_type=strategy.percent_of_equity, default_qty_value=10)

// INPUTS- 1