
Aperçu
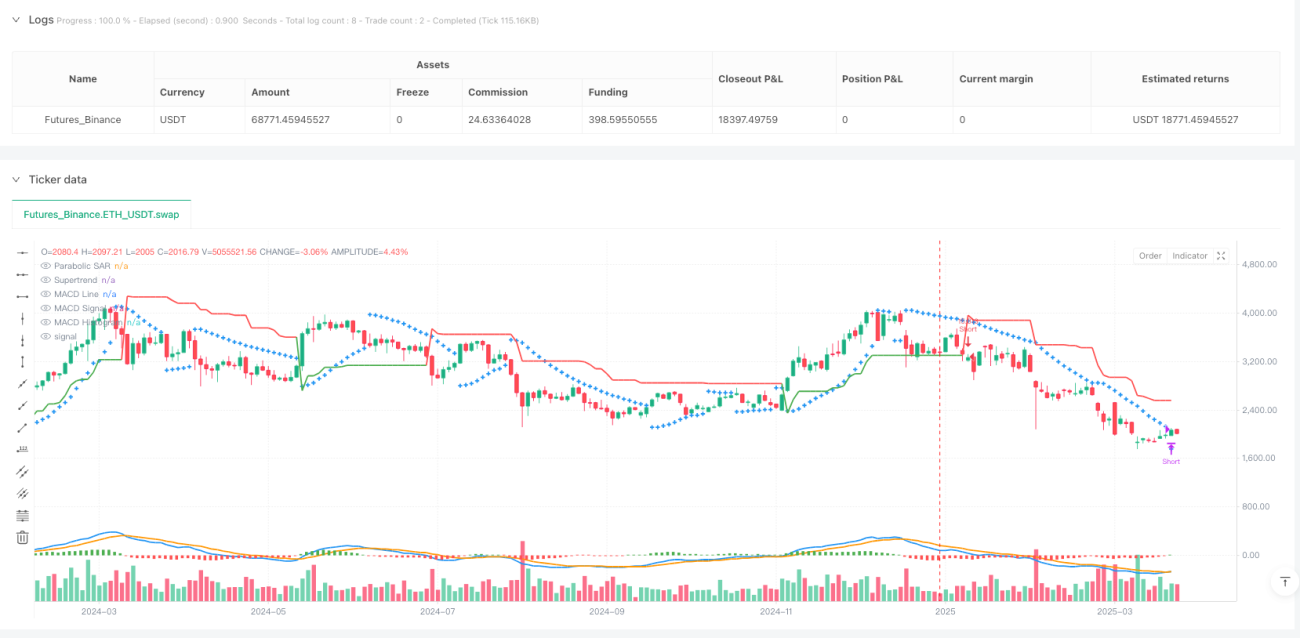
Cette stratégie est une méthode de trading quantitative et globale qui identifie les tendances du marché et les signaux de trading en intégrant plusieurs indicateurs techniques (MACD, Supertrend et Parabolic SAR). La stratégie est conçue pour fournir un cadre de décision de trading flexible et rigoureux qui peut s'adapter à différents environnements de marché.
Principe de stratégie
La stratégie est basée sur une combinaison dynamique de trois indicateurs techniques clés:
- Indicateur MACD: évaluation de la dynamique et de la direction des prix
- Indicateur de Supertrend: détermine la tendance dominante du marché (à plusieurs têtes ou à vide)
- Parabolic SAR: fournit des signaux d'entrée et de sortie précis
La stratégie utilise la logique suivante pour prendre des décisions commerciales:
- Les conditions d'entrée pour les positions longues:
- La ligne MACD est supérieure à la ligne du signal.
- La Supertrend apparaît en vert
- Le prix de clôture est supérieur à celui de Parabolic SAR
- Conditions d'entrée pour les magasins vides:
- La ligne MACD est en dessous de la ligne de signal.
- La Supertrend apparaît en rouge (en tête)
- Le prix de clôture est inférieur à Parabolic SAR
Avantages stratégiques
- Vérification intégrée multi-indicateurs: réduire le risque de faux signaux
- Un déclencheur de signal flexible: pas de séquence de déclenchement stricte
- Stratégie de trading en position totale: maximiser le potentiel de gain de chaque transaction
- Logique de transaction symétrique: une performance cohérente dans les marchés à plusieurs têtes et à vide
- Mécanisme de sortie dynamique: confirmation par deux lignes K consécutives pour éviter une sortie prématurée
Risque stratégique
- Risque de retard dans les indicateurs: les indicateurs techniques sont basés sur des données historiques et peuvent être retardés
- Risque de transaction en position pleine: le stop loss non défini peut entraîner une plus grande volatilité des fonds
- Risque de forte volatilité des marchés: un environnement de marché complexe pourrait affecter la performance stratégique
- Sensitivité des paramètres: le choix des paramètres de l'indicateur affecte directement l'efficacité de la stratégie
Orientation de l'optimisation de la stratégie
- Introduction de la gestion dynamique des positions: la taille des positions est ajustée en fonction de la volatilité du marché
- Augmentation des mécanismes de prévention des pertes: réduction des pertes maximales pour une seule transaction
- Optimiser les paramètres de l'indicateur: trouver la meilleure combinaison de paramètres par rétro-mesure
- Introduction de conditions de filtrage supplémentaires, telles que le volume des transactions et les indicateurs de volatilité
- Augmentation de la vérification multi-temps: amélioration de la fiabilité du signal
Résumer
La stratégie de négociation multi-indicateurs adaptative de Vishal est une méthode de négociation quantitative innovante qui offre un cadre de décision de négociation complet et flexible grâce à la synergie entre MACD, Supertrend et Parabolic SAR. Malgré certains risques, sa validation multi-indicateurs et sa logique de négociation symétrique offrent aux investisseurs un modèle de négociation qui mérite d'être étudié en profondeur.
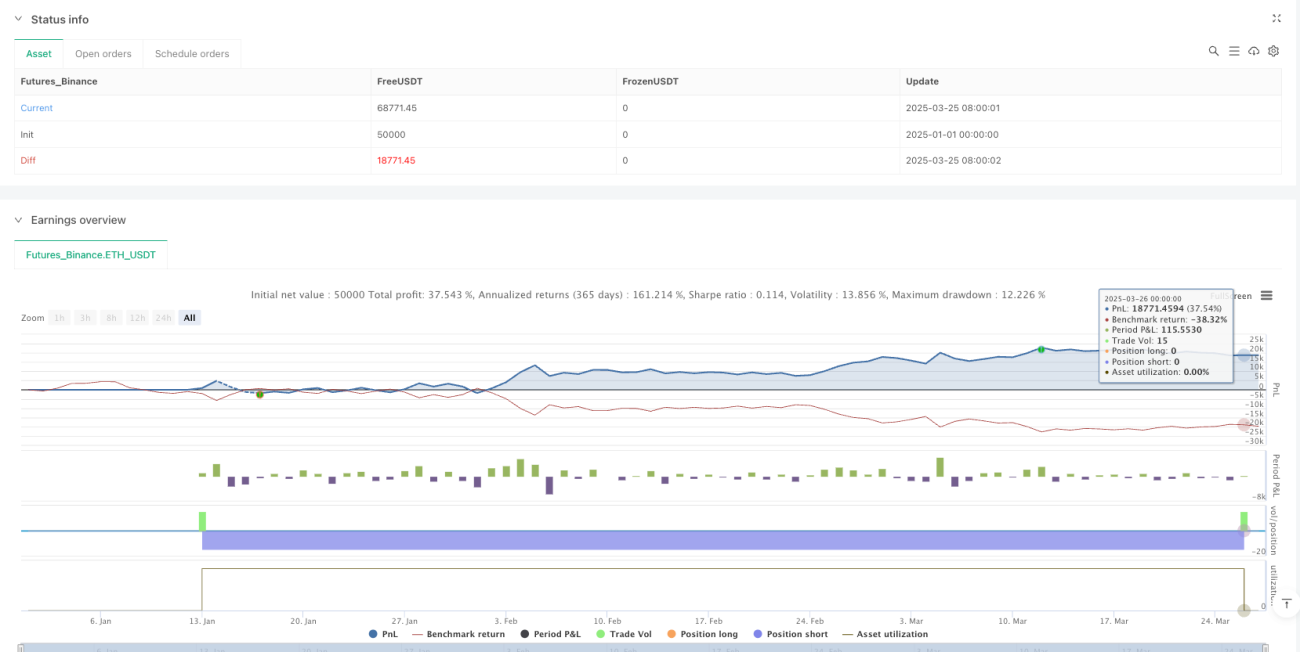
/*backtest
start: 2025-01-01 00:00:00
end: 2025-03-27 00:00:00
period: 2d
basePeriod: 2d
exchanges: [{"eid":"Futures_Binance","currency":"ETH_USDT"}]
*/

//@version=6
strategy("Vishal Strategy", overlay=true, margin_long=100, margin_short=100, initial_capital=100000, default_qty_type=strategy.percent_of_equity, default_qty_value=100)

// **MACD Inputs & Calculation**- 1