
Aperçu
La stratégie de négociation basée sur la fluctuation de la structure du marché est une méthode de négociation avancée basée sur les changements de la structure du marché, la capture de la liquidité et la dynamique de la tendance. Elle fournit aux traders un cadre de décision de négociation systématique en analysant les caractéristiques clés des changements de prix, en identifiant les occasions potentielles de revirement et de poursuite de la tendance.
Principe de stratégie
La stratégie est basée sur quatre indicateurs clés:
- Changement de caractère (CHoCH): détermine la direction potentielle du marché en identifiant les points de basculement de la tendance des prix.
- BOS (Break of Structure): confirmation de la dynamique et de la direction de la rupture de la tendance
- Inducements (IDM): Capture des pièges de liquidité et des mouvements de fonds sur les marchés.
- Les Sweeps: identifier les fausses failles et saisir les opportunités de liquidité.
La stratégie utilise des indicateurs d'analyse technique intégrés, y compris la moyenne des valeurs réelles (ATR), l'indice de force relative (RSI) et le volume de transactions, pour construire un système de décision de transaction multidimensionnel.
Avantages stratégiques
- Gestion systématique des risques: contrôle efficace du risque d'une transaction par le calcul de l'ATR pour les arrêts et arrêts de perte.
- Conditions de filtrage multiples: combinaison de CHoCH, BOS, RSI et quantité de transaction pour une meilleure précision du signal.
- Gestion dynamique des positions: utilisation des pourcentages de droits et intérêts pour définir les positions de négociation et optimiser l'efficacité de l'utilisation des fonds.
- Flexibles dans les mécanismes d'entrée et de sortie: les stratégies de négociation peuvent être adaptées en fonction de la dynamique de la structure du marché.
Risque stratégique
- Risque de fausse percée: les indicateurs de la structure du marché peuvent générer des signaux trompeurs.
- Sensitivité des paramètres: les paramètres de la stratégie ont un impact significatif sur la performance.
- Le volume et le risque de liquidité: un mauvais rendement dans un marché à faible liquidité
- Contrôle des retraits: Les marchés en tendance continue peuvent être confrontés à des retraits plus importants.
Orientation de l'optimisation de la stratégie
- L'introduction d'algorithmes d'apprentissage automatique pour optimiser le choix des paramètres et la reconnaissance des signaux.
- L'ajout d'une analyse multi-temporelle: amélioration de la fiabilité du signal.
- Développer un module de gestion dynamique des risques: modifier les positions en fonction de la volatilité du marché.
- L'intégration de plus d'indicateurs techniques comme le MACD, les bandes de Brin, etc., améliorant le filtrage des signaux.
Résumer
La stratégie de trading basée sur la fluctuation de la structure du marché est une méthode de trading quantitative avancée qui, grâce à une analyse systématique de la structure du marché, fournit aux traders un cadre de décision de trading robuste. Grâce à une optimisation continue et à une gestion des risques, la stratégie a le potentiel d'obtenir une performance de trading stable dans différents environnements de marché.
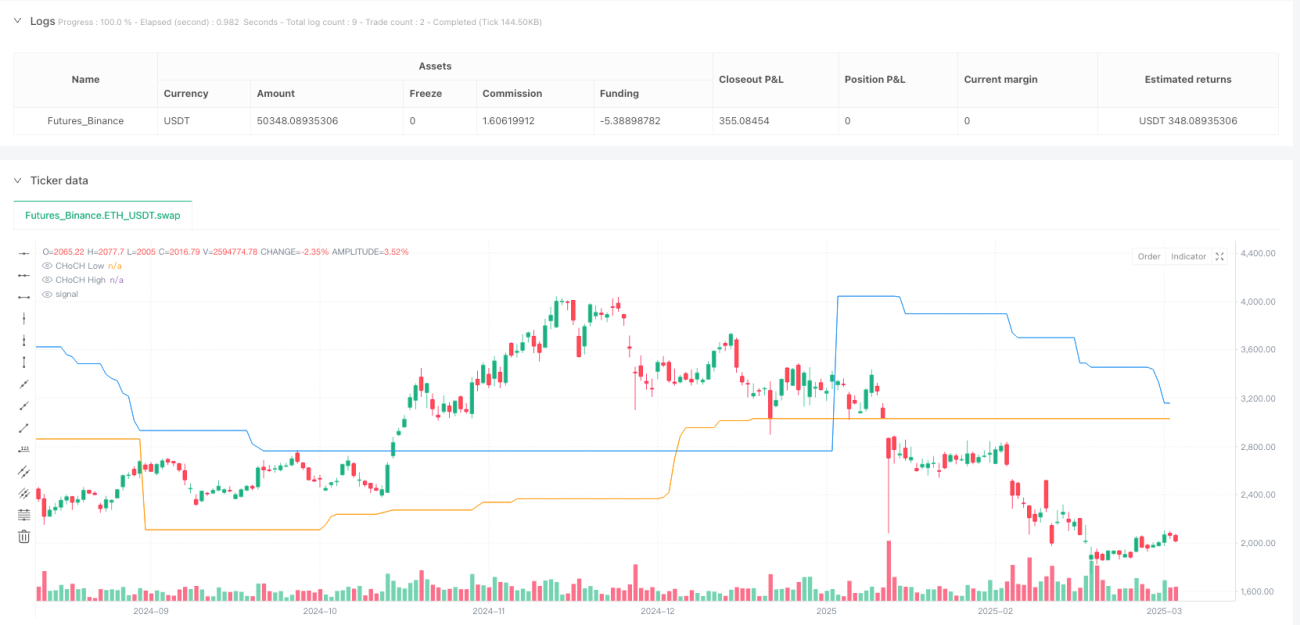
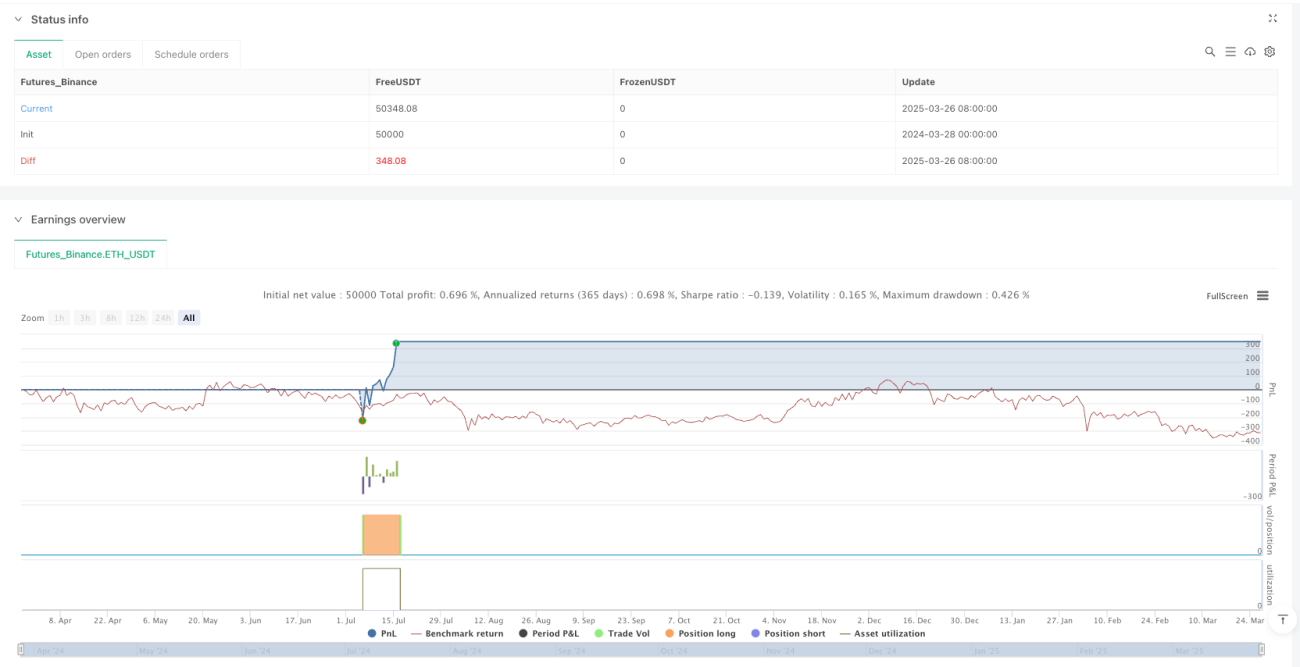
/*backtest
start: 2024-03-28 00:00:00
end: 2025-03-27 00:00:00
period: 1d
basePeriod: 1d
exchanges: [{"eid":"Futures_Binance","currency":"ETH_USDT"}]
*/

//@version=5
strategy("Market Structure Swing Trading", overlay=true, default_qty_type=strategy.percent_of_equity, default_qty_value=5)

// === Input Parameters ===- 1