
Aperçu
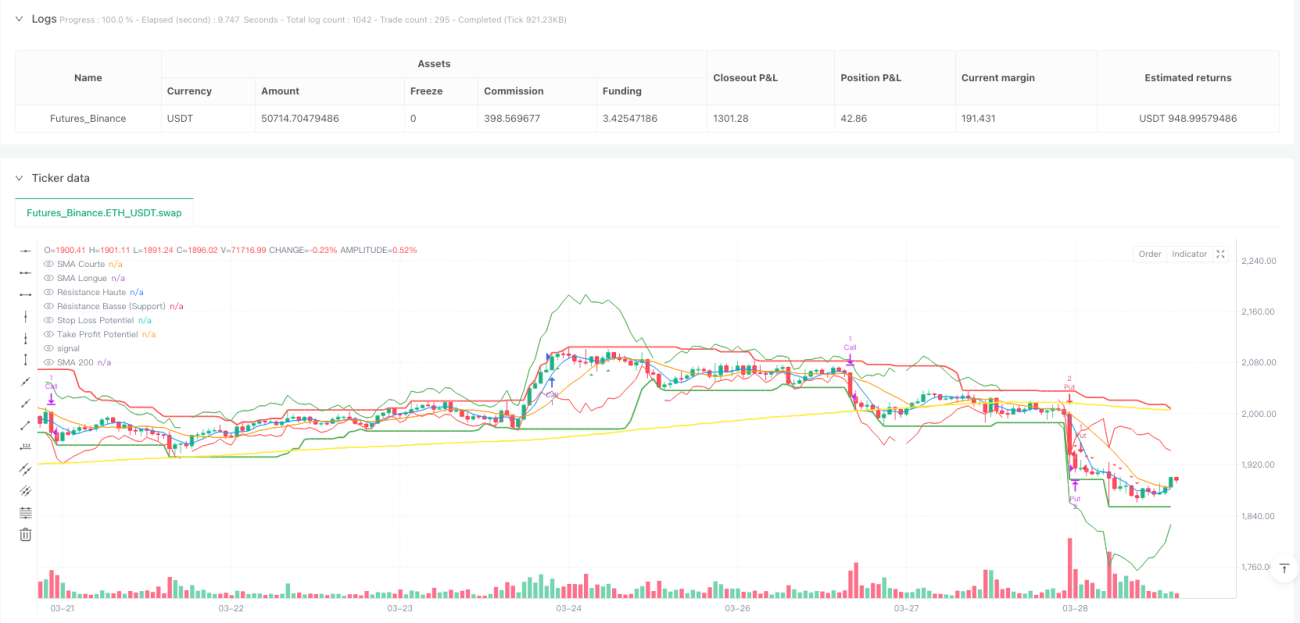
Cette stratégie est une stratégie de prédiction de tendance à court terme multidimensionnelle, qui se concentre sur l'utilisation des effets de synergie de plusieurs indicateurs techniques pour identifier et prédire les changements de tendance à court terme sur les marchés financiers. Elle intègre des outils d'analyse technique clés tels que la moyenne mobile simple (SMA), l'indice de force relative (RSI), l'indice directionnel moyen (ADX), l'Average True Range (ATR), la divergence de convergence des moyennes mobiles (MACD) et l'oscillateur stochastique (Stochastic), dans le but d'améliorer la précision et la fiabilité des signaux de trading.
Principe de la stratégie
Le principe central de cette stratégie repose sur l'analyse synergique de multiples indicateurs techniques et un mécanisme de confirmation de tendance. Les signaux de trading sont générés en tenant compte des facteurs clés suivants :
- Le croisement des moyennes mobiles à court et à long terme
- Les conditions de surachat et de survente du RSI
- Les variations des lignes MACD et de la ligne de signal
- L'indicateur de momentum de l'oscillateur stochastique
- La force de la tendance mesurée par l'ADX
- La tendance globale du marché basée sur la moyenne mobile sur 200 périodes
- La volatilité récente du marché
La stratégie calcule dynamiquement les points d'entrée potentiels, les niveaux de stop-loss et de take-profit, et ajuste ces paramètres clés en fonction de la volatilité récente du marché, permettant ainsi une gestion des risques et une exécution efficaces des transactions.
Avantages de la stratégie
- Analyse multi-indicateurs complète : en intégrant plusieurs indicateurs techniques, elle réduit le risque d'erreurs de jugement liées à un seul indicateur
- Gestion dynamique des risques : mécanismes de stop-loss et de take-profit basés sur l'ATR, permettant d'ajuster les positions en fonction de la volatilité du marché
- Cadres temporels flexibles : prise en charge de différentes périodes de trading, de 5 minutes à 4 heures
- Taille de position adaptative : ajustement dynamique de la taille des positions en fonction du capital disponible et du pourcentage de risque par transaction
- Confirmation de la force de la tendance : l'indicateur ADX permet de valider l'efficacité de la tendance, évitant ainsi les transactions fréquentes dans les marchés sans tendance claire
Risques de la stratégie
- La complexité de multiples indicateurs peut entraîner un retard dans la génération des signaux
- Dans des environnements de marché très instables, les indicateurs peuvent fournir des signaux contradictoires
- Les résultats des backtests peuvent ne pas refléter parfaitement les performances réelles futures
- Le trading à effet de levier peut amplifier considérablement les pertes
- Aucune prise en compte des facteurs fondamentaux ni des événements soudains du marché
Pistes d'optimisation
- Introduction d'algorithmes d'apprentissage automatique pour ajuster dynamiquement les poids des indicateurs
- Ajout d'indicateurs fondamentaux et sentimentaux supplémentaires
- Développement d'algorithmes de gestion de positions plus intelligents
- Personnalisation des paramètres pour différents marchés et types d'actifs
- Intégration de l'analyse en temps réel des actualités et des sentiments sur les réseaux sociaux
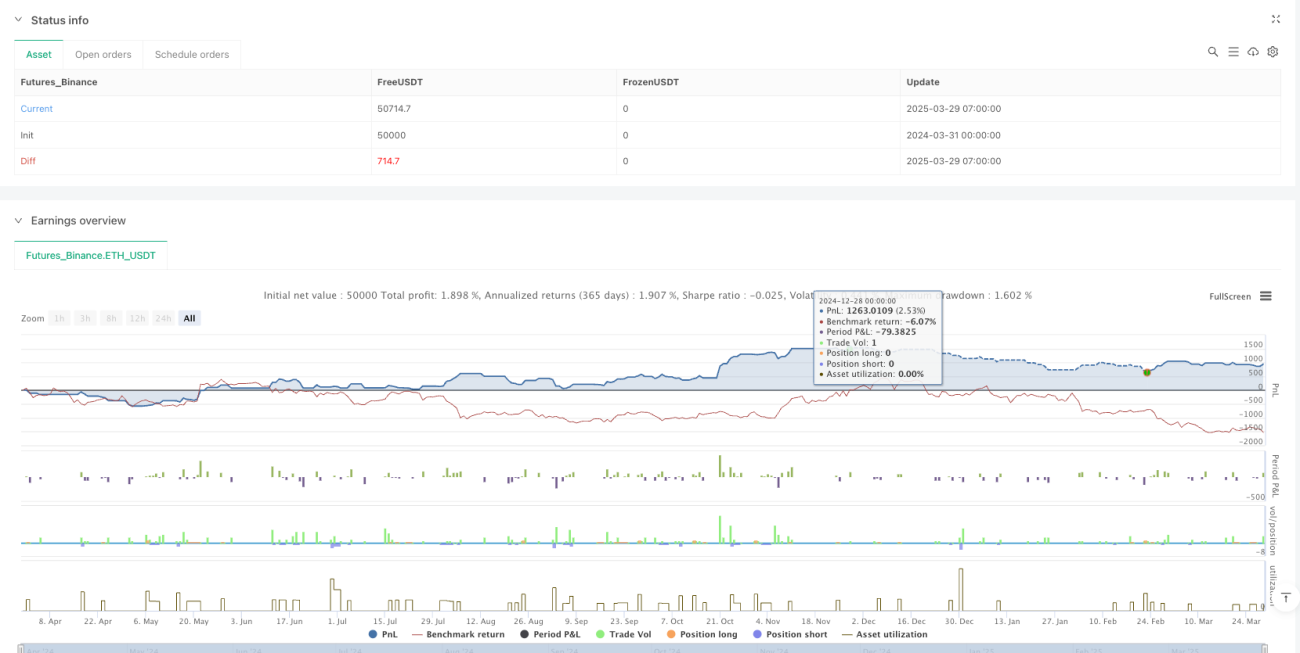
Résumé
Il s'agit d'une stratégie de prédiction de tendance à court terme multidimensionnelle et axée sur les données. En combinant un ensemble complexe d'indicateurs techniques et un mécanisme dynamique de gestion des risques, elle vise à améliorer la précision et la fiabilité des décisions de trading. Bien que la stratégie présente des avantages théoriques significatifs, une application prudente, des backtests continus et des optimisations restent nécessaires dans la pratique.
- 1