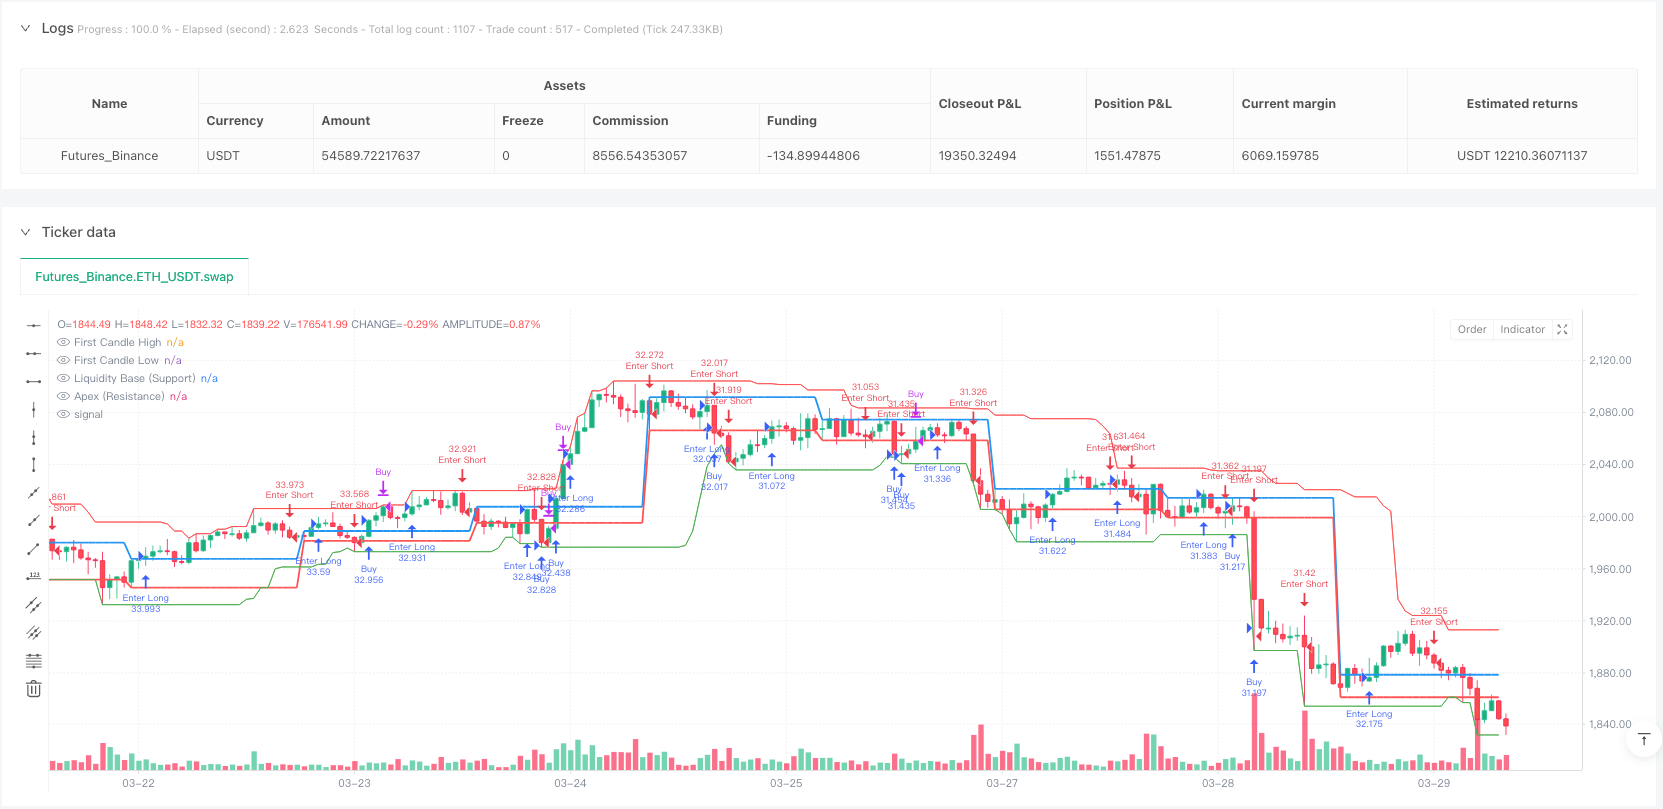
Aperçu
Il s’agit d’une stratégie de trading quantitatif innovante qui offre aux traders une méthode de trading structurée en intégrant l’entrée de zones de liquidité, la dépréciation des fluctuations ATR et la gestion dynamique du risque. La stratégie combine plusieurs indicateurs d’analyse technique pour identifier les opportunités de trading à forte probabilité et calculer automatiquement les niveaux de stop-loss et de stop-loss.
Principe de stratégie
Les principes fondamentaux de la stratégie sont basés sur les éléments clés suivants:
- Analyse des zones de liquidité: identifier les zones de soutien et de résistance potentielles en calculant les points bas et hauts d’une période donnée.
- Filtre ATR: utilise la plage de fluctuation réelle moyenne (ATR) comme seuil dynamique pour l’entrée et la gestion des risques.
- Filtre de tendance: une combinaison d’une moyenne mobile à 50 cycles (EMA) et d’un indice relativement faible (RSI) pour confirmer la tendance et la dynamique du marché.
- Gestion dynamique des risques: calcul automatique des niveaux d’arrêt et d’arrêt en fonction de l’ATR et permet un ajustement flexible du ratio risque/rendement.
Avantages stratégiques
- Génération de signaux multidimensionnels: combinaison de fluidité, de volatilité et de filtrage de tendances pour améliorer la qualité du signal.
- Gestion des risques adaptative: réglage dynamique des stop-loss et contrôle efficace des risques de transaction.
- Configuration de paramètres flexible: la longueur de l’ATR, le cycle de liquidité et le moment de la transaction peuvent être personnalisés.
- Prise en charge visuelle: affichage visuel des lignes de fluidité et du premier niveau de la ligne K.
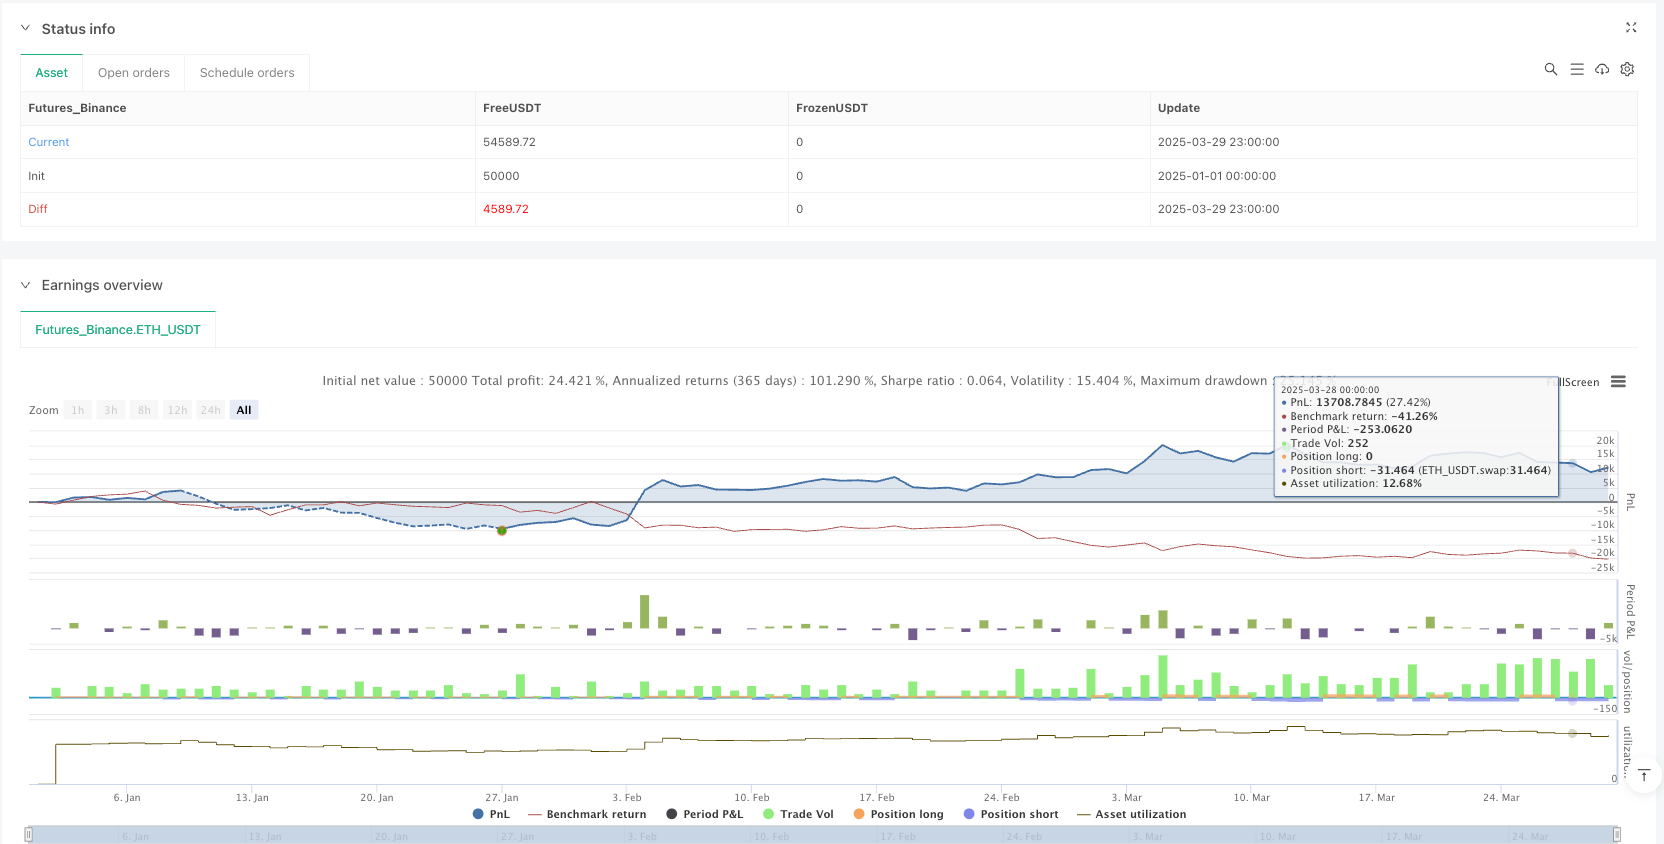
- Suivi des performances: tableaux de transaction intégrés, affichant les taux de victoire et de défaite directement sur le graphique.
Risque stratégique
- Sensibilité aux paramètres: la performance de la stratégie est fortement dépendante de la sélection des paramètres, ce qui nécessite un suivi et une optimisation constants.
- Adaptabilité du marché: la performance peut être instable dans des marchés où les tendances ne sont pas évidentes ou très volatiles.
- Risque de fausse intrusion: la possibilité d’une fausse déclaration de l’intrusion dans une zone de liquidité.
- Fréquence des transactions: le filtrage des sessions et les conditions multiples peuvent réduire les opportunités de transactions.
- La rétrospective est biaisée: 64% de victoires historiques peuvent ne pas être représentatives des performances futures.
Orientation de l’optimisation de la stratégie
- Intégration de l’apprentissage automatique: introduire des algorithmes d’apprentissage automatique pour ajuster dynamiquement les paramètres et la génération de signaux.
- Adaptabilité multi-marché: développer des paramètres plus généraux pour différents marchés et variétés.
- Gestion des risques en profondeur: introduction d’une taille de position et d’algorithmes de répartition des risques plus complexes.
- Mécanisme de confirmation des signaux: ajout d’indicateurs de confirmation supplémentaires, tels que le volume de transactions ou d’autres indicateurs techniques.
- Surveillance des performances en temps réel: développement de modules d’évaluation des performances en temps réel et d’ajustement adaptatif.
Résumer
La stratégie de trading ThinkTech AI offre aux traders un puissant outil de trading quantitatif grâce à une approche multi-facteurs innovante. La stratégie vise à identifier des opportunités de trading de haute qualité grâce à l’analyse de la liquidité, au filtrage de la volatilité et à la gestion dynamique du risque.
/*backtest
start: 2025-01-01 00:00:00
end: 2025-03-30 00:00:00
period: 1h
basePeriod: 1h
exchanges: [{"eid":"Futures_Binance","currency":"ETH_USDT"}]
*/

if high > ta.highest(high[1], 5)
    strategy.entry("Enter Long", strategy.long)
else if low < ta.lowest(low[1], 5)
    strategy.entry("Enter Short", strategy.short)//@version=6
strategy("ThinkTech AI Signals", overlay=true, initial_capital=100000, default_qty_type=strategy.percent_of_equity, default_qty_value=100)

//──────────────────────────────
// Input Settings
//──────────────────────────────
riskRewardRatio    = input.float(title="Risk/Reward Ratio", defval=2.0, minval=1.0, step=0.1)

// Inputs from second script
liquidity_period   = input.int(20, title="Liquidity Base Period")
atr_length         = input.int(14, title="ATR Length")
atr_threshold      = input.float(0.3, title="ATR Breakout Threshold")
take_profit_mult   = input.float(0.25, title="Take-Profit Multiplier")
stop_loss_mult     = input.float(0.75, title="Stop-Loss Multiplier")
vol_filter         = input.bool(true, title="Enable Volume Filter")
session_filter     = input.bool(true, title="Limit to Trading Session")

// Additional inputs for further filtering and settings
atrMultiplier      = input.float(title="ATR Multiplier for Stop Loss", defval=1.5, minval=0.1, step=0.1)
retestCushionLong  = input.float(title="Retest Cushion Factor for BUY", defval=1.0, minval=1.0, step=0.001)
retestCushionShort = input.float(title="Retest Cushion Factor for SELL", defval=1.0, minval=0.0, maxval=1.0, step=0.001)
useTrendFilter     = input.bool(title="Use 50 EMA Trend Filter", defval=true)
useRSIFilter       = input.bool(title="Use RSI Filter", defval=false)
rsiPeriod          = input.int(title="RSI Period", defval=14, minval=1)
rsiOversold        = input.float(title="RSI Oversold Level", defval=30.0, minval=1, maxval=50)
rsiOverbought      = input.float(title="RSI Overbought Level", defval=70.0, minval=50, maxval=100)

// Option to remove plotted lines
showLiquidityLines   = input.bool(true, title="Show Liquidity Lines")
showFirstCandleLines = input.bool(true, title="Show First Candle Level Lines")

//──────────────────────────────
// Calculations & Variables (Liquidity & ATR Based)
//──────────────────────────────
price        = close
atr          = ta.atr(atr_length)
vol_condition = volume > ta.sma(volume, 20)

// Define Liquidity Base and Apex for support/resistance
liquidity_base = ta.lowest(low, liquidity_period)
apex           = ta.highest(high, liquidity_period)
// Track recent highs and lows for filtering
hh = ta.highest(high, 30)
ll = ta.lowest(low, 30)

//──────────────────────────────
// Trade Stats Variables
//──────────────────────────────
var float take_profit = na
var float stop_loss   = na
var bool  in_trade    = false
var int   win_count   = 0
var int   loss_count  = 0

//──────────────────────────────
// ENTRY LOGIC (BUY) Based on Liquidity & ATR
//──────────────────────────────
breakout_up      = price > liquidity_base + (atr * atr_threshold)
point_of_release = ta.crossover(price, liquidity_base) and breakout_up
retest_buy       = price > liquidity_base and price < hh and not in_trade

// Session condition (e.g. trading between 9AM–12PM)
session_condition = (hour >= 9 and hour <= 12) or not session_filter

if (point_of_release or retest_buy) and (vol_condition or not vol_filter) and session_condition
    strategy.entry("Buy", strategy.long)
    take_profit := price + (atr * take_profit_mult)
    stop_loss   := liquidity_base - (atr * stop_loss_mult)
    in_trade    := true
    alert("Buy Signal - Price: " + str.tostring(price), alert.freq_once_per_bar)

//──────────────────────────────
// ENTRY LOGIC (SELL) Based on Liquidity & ATR
//──────────────────────────────
breakout_down = price < apex - (atr * atr_threshold)
clean_break   = ta.crossunder(price, apex) and breakout_down
retest_sell   = price < apex and price > ll and not in_trade

if (clean_break or retest_sell) and (vol_condition or not vol_filter) and session_condition
    strategy.entry("Sell", strategy.short)
    take_profit := price - (atr * take_profit_mult)
    stop_loss   := apex + (atr * stop_loss_mult)
    in_trade    := true
    alert("Sell Signal - Price: " + str.tostring(price), alert.freq_once_per_bar)

//──────────────────────────────
// EXIT LOGIC (For BUY & SELL)
//──────────────────────────────
if strategy.position_size > 0
    if price >= take_profit
        strategy.close("Buy", comment="Take Profit")
        win_count += 1
        in_trade := false
    if price <= stop_loss
        strategy.close("Buy", comment="Stop Loss")
        loss_count += 1
        in_trade := false

if strategy.position_size < 0
    if price <= take_profit
        strategy.close("Sell", comment="Take Profit")
        win_count += 1
        in_trade := false
    if price >= stop_loss
        strategy.close("Sell", comment="Stop Loss")
        loss_count += 1
        in_trade := false

//──────────────────────────────
// Plot Liquidity Lines (Support/Resistance)
//──────────────────────────────
plot(showLiquidityLines ? liquidity_base : na, color=color.green, title="Liquidity Base (Support)")
plot(showLiquidityLines ? apex : na, color=color.red, title="Apex (Resistance)")

//──────────────────────────────
// Debugging Signal Shapes
//──────────────────────────────
plotshape(series=point_of_release, location=location.belowbar, color=color.green, style=shape.triangleup, title="Buy Signal")
plotshape(series=clean_break, location=location.abovebar, color=color.red, style=shape.triangledown, title="Sell Signal")

//──────────────────────────────
// Win/Loss Table Display
//──────────────────────────────
var table t = table.new(position.top_right, 1, 2)
if bar_index == last_bar_index
    table.cell(t, 0, 0, "Wins: " + str.tostring(win_count), bgcolor=color.new(color.green, 80))
    table.cell(t, 0, 1, "Losses: " + str.tostring(loss_count), bgcolor=color.new(color.red, 80))

//──────────────────────────────
// Alert Conditions for Entries and Exits
//──────────────────────────────
alertcondition(point_of_release, title="Buy Alert", message="Buy Signal Triggered")
alertcondition(clean_break, title="Sell Alert", message="Sell Signal Triggered")
var int lastClosedTrades = 0
var bool exitSignal = false
if strategy.closedtrades > lastClosedTrades
    exitSignal := true
    lastClosedTrades := strategy.closedtrades
alertcondition(exitSignal, title="EXIT Signal", message="EXIT signal triggered: Trade has closed (TP or SL reached).")

//──────────────────────────────
// FIRST 15-MINUTE CANDLE CAPTURE (9:30–9:45 AM EST)
//──────────────────────────────
newDay = dayofmonth != dayofmonth[1]
var float fHigh = na
var float fLow  = na
var bool  firstCandleCaptured = false
if newDay
    fHigh := high
    fLow  := low
    firstCandleCaptured := true

//──────────────────────────────
// Additional Filters & Calculations
//──────────────────────────────
// Trend Filter: 50 EMA
ema50       = ta.ema(close, 50)
longFilter  = not useTrendFilter or (close > ema50)
shortFilter = not useTrendFilter or (close < ema50)

// ATR-Based Stop Loss Buffer
atrValue       = ta.atr(14)
stopLossBuffer = atrValue * atrMultiplier

// RSI Calculation (if enabled)
rsiValue = ta.rsi(close, rsiPeriod)

//──────────────────────────────
// ENTRY CONDITIONS (15-Minute Candle Retest)
//──────────────────────────────
// Breakout/Breakdown based on the first candle levels
buyBreakout   = firstCandleCaptured and ta.crossover(close, fHigh)
sellBreakdown = firstCandleCaptured and ta.crossunder(close, fLow)
// Retest conditions: price must retest the level after the breakout/breakdown
buyRetest  = firstCandleCaptured and (low <= fHigh) and (close > fHigh)
sellRetest = firstCandleCaptured and (high >= fLow) and (close < fLow)
// Final entry signals (with optional RSI filter)
buySignal  = buyBreakout and buyRetest and longFilter and (strategy.position_size == 0) and (not useRSIFilter or (rsiValue < rsiOversold))
sellSignal = sellBreakdown and sellRetest and shortFilter and (strategy.position_size == 0) and (not useRSIFilter or (rsiValue > rsiOverbought))

//──────────────────────────────
// Trade Parameters for 15-Minute Candle Retest
//──────────────────────────────
candleRange    = fHigh - fLow
stopLossBuy    = fLow - stopLossBuffer
takeProfitBuy  = fHigh + (candleRange * riskRewardRatio)
stopLossSell   = fHigh + stopLossBuffer
takeProfitSell = fLow - (candleRange * riskRewardRatio)

//──────────────────────────────
// Execute Trades for 15-Minute Candle Retest
//──────────────────────────────
if buySignal
    strategy.entry("BUY", strategy.long)
    strategy.exit("TP/SL BUY", "BUY", stop=stopLossBuy, limit=takeProfitBuy)

if sellSignal
    strategy.entry("SELL", strategy.short)
    strategy.exit("TP/SL SELL", "SELL", stop=stopLossSell, limit=takeProfitSell)

//──────────────────────────────
// Plot First Candle Level Lines (Optional)
//──────────────────────────────
plot(showFirstCandleLines and firstCandleCaptured ? fHigh : na, title="First Candle High", color=color.blue, linewidth=2)
plot(showFirstCandleLines and firstCandleCaptured ? fLow : na, title="First Candle Low", color=color.red, linewidth=2)