Stratégie de trading quantitatif de suivi de tendance basée sur des indicateurs de momentum multiples

Aperçu
La stratégie de trading quantitatif de suivi de tendance à indices de momentum multiples est une approche de trading quantitatif composite qui combine les moyennes mobiles exponentielles (EMA), l'indice de force relative (RSI) et la divergence de convergence de moyenne mobile (MACD). En intégrant plusieurs indicateurs techniques, cette stratégie vise à améliorer la précision et la fiabilité des signaux de trading, et est particulièrement adaptée au trading à court et moyen terme sur les marchés à forte volatilité.
Principe de la stratégie
Le principe central de cette stratégie repose sur une validation conjointe de multiples indicateurs :
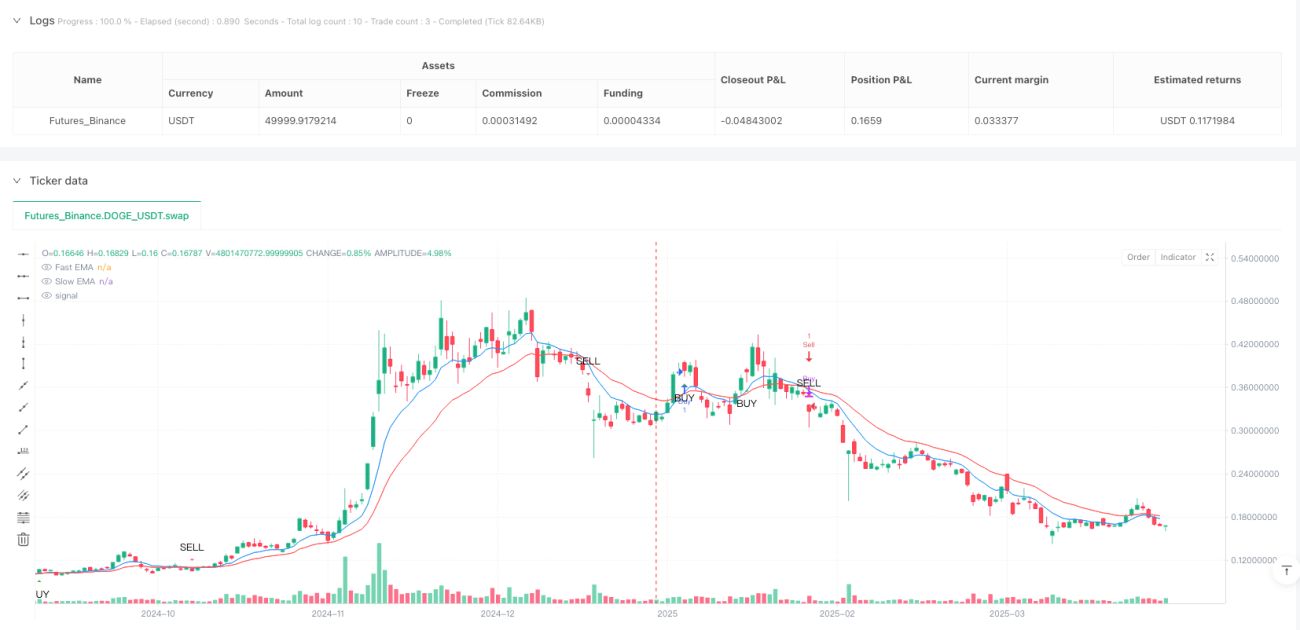
- Utilisation de l'EMA rapide (période 9) et de l'EMA lente (période 21) pour déterminer la direction de la tendance et les changements de momentum.
- Confirmation du momentum du marché et des conditions de surachat/survente via le RSI (période 14).
- Utilisation de l'indicateur MACD pour valider le momentum et la direction de la tendance.
Règles de génération des signaux de trading :
- Lorsque l'EMA rapide croise au-dessus de l'EMA lente, que le RSI > 50 et que la ligne MACD est au-dessus de la ligne de signal, un signal d'achat est généré.
- Lorsque l'EMA rapide croise en dessous de l'EMA lente, que le RSI < 50 et que la ligne MACD est en dessous de la ligne de signal, un signal de vente est généré.
Avantages de la stratégie
- Validation conjointe de plusieurs indicateurs, réduisant considérablement le risque de faux signaux.
- Capture dynamique des changements de tendance du marché, forte adaptabilité.
- Paramètres ajustables pour s'adapter à différents environnements de marché.
- Logique de génération de signaux claire, facile à comprendre et à mettre en œuvre.
- Adaptée au trading à court et moyen terme sur les marchés à forte volatilité.
Risques de la stratégie
- Peut générer des transactions inefficaces fréquentes dans les marchés latéraux.
- Un mauvais choix des paramètres des indicateurs peut réduire l'efficacité du trading.
- Ne prend pas en compte les coûts de transaction et l'impact du slippage.
- La stabilité de la stratégie est limitée dans des environnements de marché uniques.
Axes d'optimisation de la stratégie
- Introduction de conditions de filtrage supplémentaires, comme la confirmation du volume.
- Ajout de mécanismes de stop-loss et de take-profit.
- Ajustement dynamique des paramètres de l'EMA, du RSI et du MACD.
- Développement d'algorithmes d'adaptation de paramètres basés sur l'apprentissage automatique.
- Introduction d'indicateurs d'évaluation d'environnements de marché supplémentaires.
Conclusion
La stratégie de trading quantitatif de suivi de tendance à indices de momentum multiples construit un système de génération de signaux de trading relativement robuste en intégrant trois indicateurs techniques clés : l'EMA, le RSI et le MACD. Cette stratégie conserve une flexibilité suffisante tout en offrant une capacité de contrôle des risques solide, fournissant ainsi aux traders quantitatifs une solution de trading digne d'une étude approfondie.
- 1