Stratégie de stop loss dynamique de suivi des tendances quantitatives longues et courtes

Aperçu
Il s'agit d'une stratégie de suivi de tendance multifonctionnelle basée sur la gamme moyenne des fluctuations réelles (ATR) et les moyennes mobiles de l'indice (EMA). La stratégie permet une capture précise et une gestion des risques des tendances du marché grâce à des arrêts et des jugements de tendance dynamiques.
Principe de stratégie
Les principes de base de la stratégie comprennent les étapes clés suivantes:
- Calcul du point de rupture dynamique avec l'indicateur ATR
- Les prix ont évolué en fonction de l'EMA.
- Détermination du signal de transaction par la position relative du prix par rapport au point de rupture
- Sélectivement optimiser la reconnaissance du signal à l'aide du schéma Heikin Ashi
La logique principale du calcul:
- Le point d'arrêt dynamique = prix actuel ± (ATR * facteur sensible)
- La tendance est déterminée par le croisement de l'EMA et du point de rupture
- Un signal de transaction est généré lorsque le prix franchit le point de rupture et que l'EMA se trouve à la croisée des chemins
Avantages stratégiques
- Gestion dynamique des risques: ATR s'adapte au calcul des points d'arrêt et s'adapte en temps réel aux fluctuations du marché
- Suivi de la tendance avec précision: l'EMA réagit rapidement aux variations de prix et capture les virages de tendance
- Flexibilité: cycle ATR et coefficient de sensibilité personnalisables
- Une carte optionnelle d'Heikhan Achitra pour optimiser encore plus la reconnaissance des signaux
- Les transactions à basse fréquence et les coûts de transaction
- Adapté à plusieurs marchés et variétés
Risque stratégique
- Les marchés en crise peuvent générer de fréquents faux signaux
- Une mauvaise configuration des paramètres peut entraîner des transactions excessives
- Faute de prise en compte des facteurs fondamentaux et de l'impact des événements inattendus
- Il y a une certaine différence entre la détection et le disque dur.
Suggestions de contrôle des risques :
- Optimiser les paramètres et réduire le facteur de sensibilité
- Confirmation associée à d'autres indicateurs
- Mise en place de stop-loss et de gestion des positions
- Surveillance continue et adaptation dynamique
Orientation de l'optimisation de la stratégie
- Paramètres d'optimisation dynamique pour les algorithmes d'apprentissage automatique
- Ajout d'une vérification à plusieurs périodes
- Combiné avec d'autres indices techniques
- Développement d'un mécanisme de sélection de paramètres adaptatifs
- Ajout de modules d'ajustement au risque
Objectifs d'optimisation: améliorer la stabilité stratégique, réduire les retraits et améliorer la rentabilité
Résumer
Il s'agit d'une stratégie de suivi de tendance dynamique basée sur l'ATR et l'EMA, permettant une participation relativement stable sur le marché grâce à des mécanismes de stop loss et de jugement de tendance flexibles. La stratégie présente de bonnes caractéristiques d'adaptation et de gestion des risques, mais nécessite une optimisation et une vérification continues.
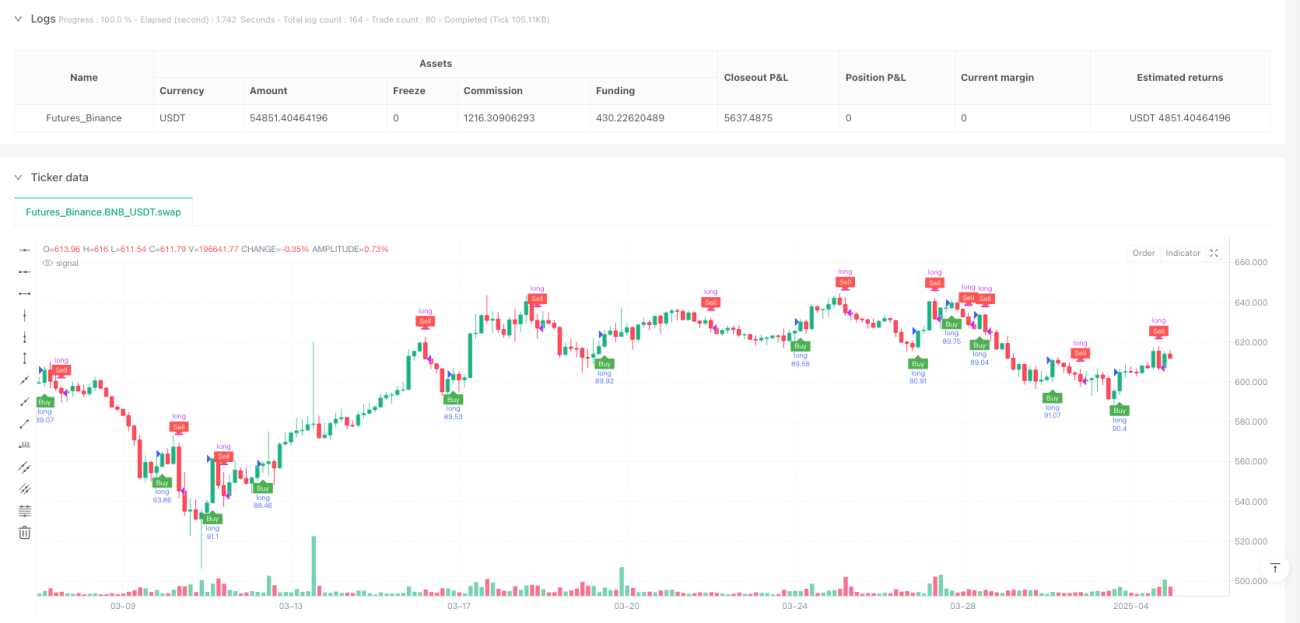
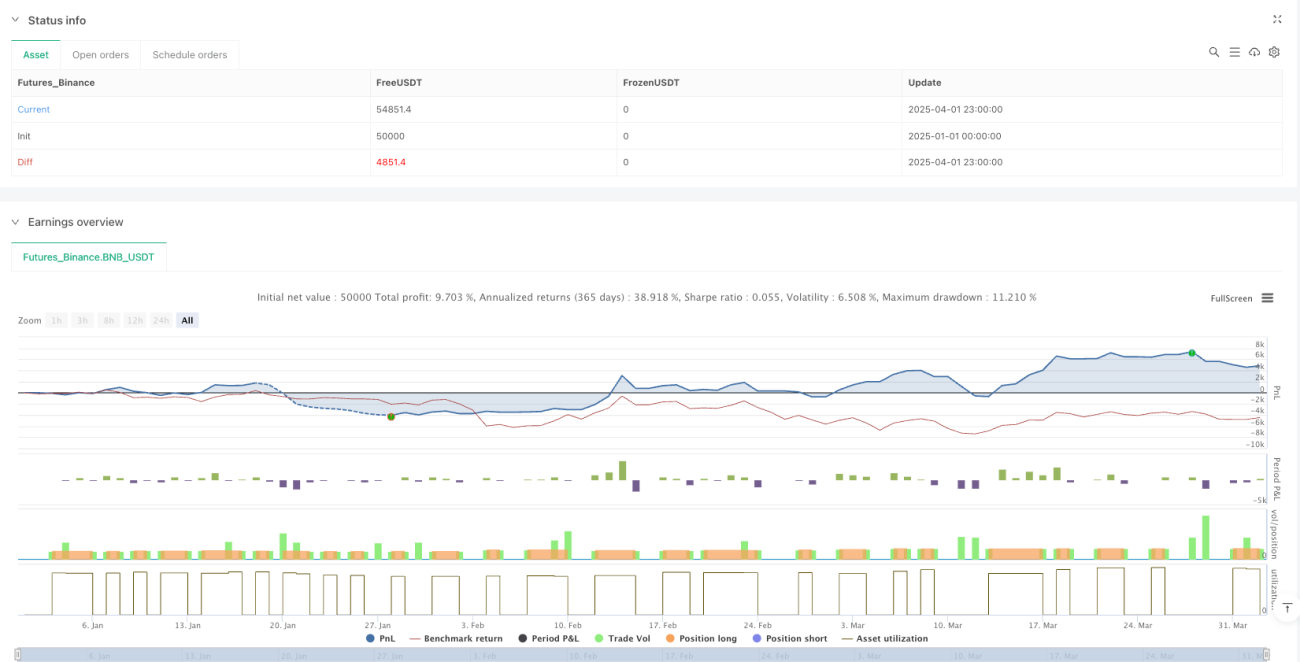
/*backtest
start: 2025-01-01 00:00:00
end: 2025-04-02 00:00:00
period: 3h
basePeriod: 3h
exchanges: [{"eid":"Futures_Binance","currency":"BNB_USDT"}]
*/

//@version=6
strategy("ducanhmaster v1", overlay=true, commission_type=strategy.commission.percent, commission_value=0.1, slippage=3, default_qty_type=strategy.percent_of_equity, default_qty_value=100)

// Inputs- 1