
Aperçu
La stratégie de dynamique d'adaptation des tendances de la théorie Dow est une méthode de négociation avancée basée sur les principes de la théorie Dow classique, qui guide les décisions de négociation en identifiant les points de basculement clés des tendances du marché. Cette stratégie se concentre sur la détection et la confirmation de la dynamique de base de la tendance des prix, en utilisant des hauts plus élevés (Higher Highs) et des bas plus élevés (Higher Lows) pour définir une tendance à la hausse et des basses (Lower Highs) et des basses (Lower Lows) pour définir une tendance à la baisse.
Principe de stratégie
Le principe de base de la stratégie est basé sur les méthodes classiques de reconnaissance de tendances de la théorie de Dow. La stratégie détecte les points de basculement critiques en utilisant les fonctions ta.pivothigh () et ta.pivotlow (). La mise en œuvre spécifique comprend les étapes suivantes:
- Détection des points de basculement: déterminer le nombre de colonnes sur les côtés droit et gauche à l'aide des paramètres pivotLookback, pour identifier les points hauts et les points bas.
- Confirmation de tendance: une tendance à la hausse n'est confirmée que si les conditions d'un plus haut sommet et d'un plus bas sommet sont réunies simultanément; de même, une tendance à la baisse n'est confirmée que si les conditions d'un plus bas sommet et d'un plus bas sommet sont réunies simultanément.
- Continuité de tendance: si les conditions de conversion de tendance ne sont pas remplies, la stratégie conserve l'état de tendance précédent, ce qui permet un suivi de tendance plus fluide.
Avantages stratégiques
- Identification des tendances dynamiques: en analysant en permanence les points de basculement, la stratégie est capable de capturer dynamiquement les changements de tendances du marché.
- Modes de négociation flexibles: trois modes de négociation sont proposés pour répondre aux besoins des différents traders: automatique, simple et simple.
- Gestion des risques: un mécanisme de stop-loss et de stop-loss intégré permet de contrôler efficacement le risque d'une transaction.
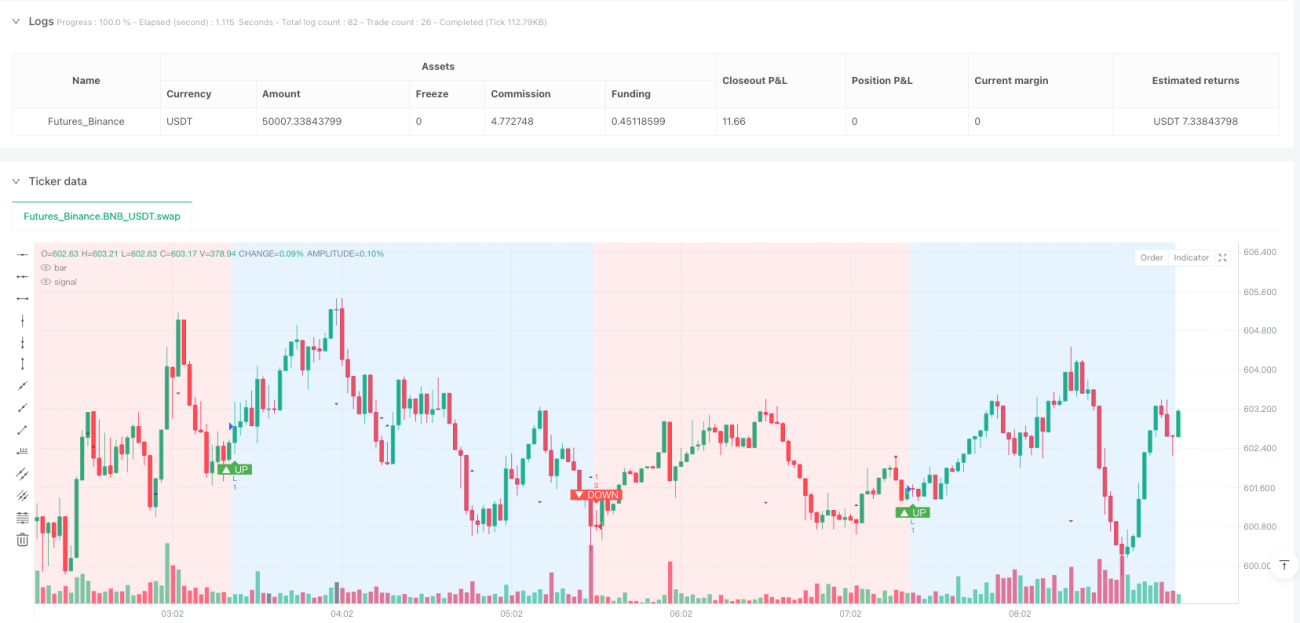
- Visualisation des tendances: les couleurs de fond et les marqueurs permettent aux traders de visualiser les tendances et de comprendre rapidement l'état du marché.
- Faible latence: cette méthode permet de répondre plus rapidement aux changements de tendance que les stratégies traditionnelles de moyennes mobiles.
Risque stratégique
- Risque de retard: Le risque de retard inhérent à la stratégie est qu'elle ne puisse pas capturer les premiers signaux de tendance en raison de l'utilisation de la détection des virages.
- Risque de choc du marché: dans les marchés où la volatilité n'est pas évidente, des fluctuations fréquentes et mineures des prix peuvent conduire à des transactions inutiles.
- Sensitivité des paramètres: le choix des paramètres pivotLookback a un impact significatif sur la performance de la stratégie et nécessite des ajustements selon les marchés et les délais.
- Coûts de transaction: la fréquence des transactions peut entraîner des coûts de transaction plus élevés, en particulier lorsque les commissions sont plus élevées.
Orientation de l'optimisation de la stratégie
- Introduction de filtres additionnels: ils sont combinés avec des indicateurs de force de tendance (comme ATR) pour filtrer les signaux de tendance faibles.
- Adaptation dynamique des paramètres: développement d'un mécanisme de paramètres de pivot Lookback qui s'adapte automatiquement en fonction de la volatilité du marché
- Vérification de plusieurs périodes: Vérification croisée des signaux de tendance sur différentes périodes, améliorant ainsi la fiabilité des signaux.
- L'amélioration de l'apprentissage automatique: explorer l'utilisation d'algorithmes d'apprentissage automatique pour optimiser la reconnaissance des tendances et l'heure d'entrée.
- Optimisation de la gestion des risques: ajustement des arrêts et des freins en fonction de la dynamique de la volatilité du marché
Résumer
La stratégie de dynamique d'adaptation de la théorie Dow est une puissante méthode de suivi de la tendance qui offre aux traders un outil de reconnaissance de tendance systématique grâce à une technologie d'analyse innovante des points de basculement. Malgré certains risques inhérents, sa flexibilité et sa dynamique en font une méthode précieuse dans les stratégies de trading quantitatif modernes. La mise en œuvre réussie de la stratégie nécessite une compréhension approfondie de son fonctionnement et une optimisation et une adaptation continues en fonction des conditions spécifiques du marché.
Overview
The Dow Theory Trend Adaptive Momentum Strategy is an advanced trading approach based on classic Dow Theory principles, designed to guide trading decisions by identifying key turning points in market trends. The strategy focuses on detecting and confirming the fundamental dynamics of price trends, using Higher Highs and Higher Lows to define uptrends, and Lower Highs and Lower Lows to define downtrends. This method aims to provide a systematic approach to capturing market trends and responding promptly when trends change.
Strategy Principles
The core principle of this strategy is based on the classic Dow Theory trend identification method. The strategy detects key turning points using ta.pivothigh() and ta.pivotlow() functions. Specific implementation includes the following key steps:
- Turning Point Detection: Use the pivotLookback parameter to determine the number of bars on both sides for identifying highs and lows.
- Trend Confirmation: An uptrend is confirmed only when both Higher Highs and Higher Lows conditions are met; similarly, a downtrend is confirmed only when both Lower Highs and Lower Lows conditions are satisfied.
- Trend Persistence: If trend conversion conditions are not met, the strategy maintains the previous trend state, achieving smoother trend tracking.
Strategy Advantages
- Dynamic Trend Identification: By continuously analyzing key turning points, the strategy can dynamically capture market trend changes.
- Flexible Trading Modes: Provides three trading modes - automatic, long-only, and short-only - to meet different traders' needs.
- Risk Management: Built-in stop-loss and take-profit mechanisms effectively control the risk of individual trades.
- Trend Visualization: Intuitively displays trend direction through background colors and markers, making it easy for traders to understand market conditions.
- Low Latency: Compared to traditional moving average strategies, this method can respond to trend changes more quickly.
Strategy Risks
- Lag Risk: Due to using pivot point detection, the strategy inherently carries a lag risk and may not capture the earliest trend signals.
- Ranging Market Risk: In markets with unclear fluctuations, frequent small price changes may lead to unnecessary trades.
- Parameter Sensitivity: The choice of pivotLookback parameter significantly impacts strategy performance and requires adjustment for different markets and timeframes.
- Trading Costs: Frequent trading may result in high transaction costs, especially with higher commission rates.
Strategy Optimization Directions
- Introduce Additional Filters: Combine trend strength indicators (such as ATR) to filter weak trend signals.
- Dynamic Parameter Adjustment: Develop an adaptive pivotLookback parameter mechanism based on market volatility.
- Multi-Timeframe Verification: Cross-verify trend signals across different timeframes to improve signal reliability.
- Machine Learning Enhancement: Explore using machine learning algorithms to optimize trend identification and entry timing.
- Risk Management Optimization: Dynamically adjust stop-loss and take-profit distances based on market volatility.
Conclusion
The Dow Theory Trend Adaptive Momentum Strategy is a powerful trend-following method that provides traders with a systematic trend identification tool through innovative turning point analysis techniques. Despite some inherent risks, its flexibility and dynamism make it a valuable approach in modern quantitative trading strategies. Successfully applying this strategy requires a deep understanding of its working principles and continuous optimization and adjustment based on specific market environments.
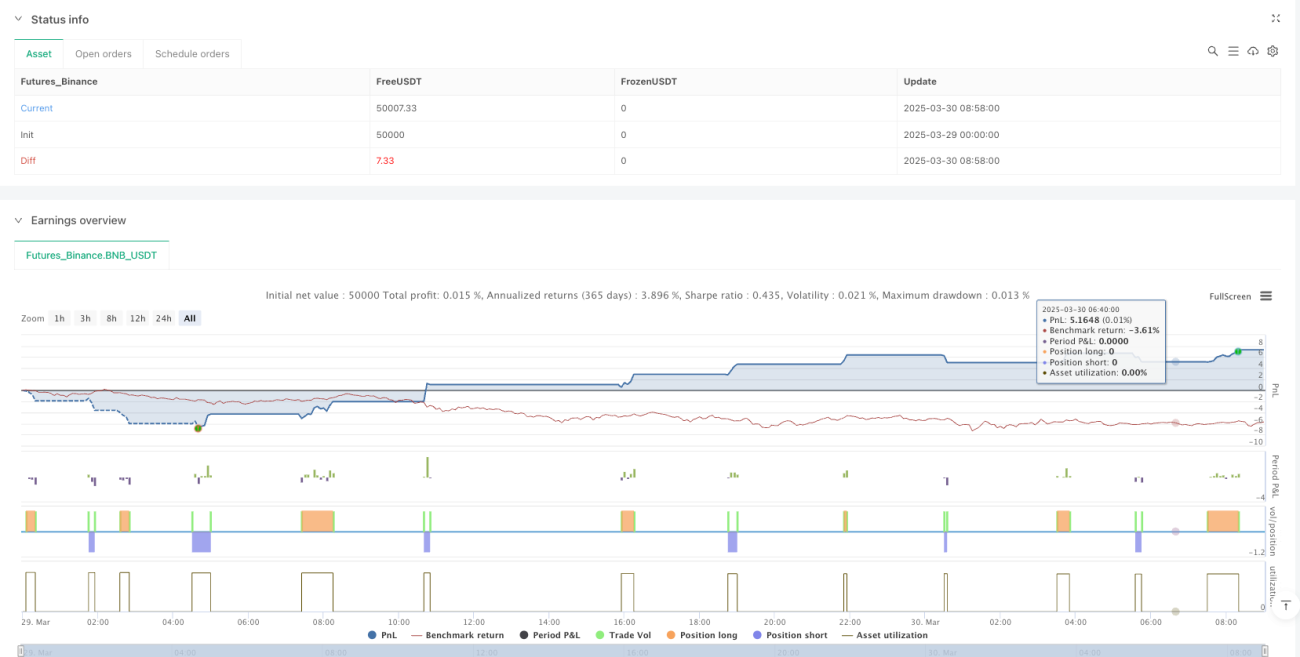
/*backtest
start: 2025-03-29 00:00:00
end: 2025-03-30 09:00:00
period: 2m
basePeriod: 2m
exchanges: [{"eid":"Futures_Binance","currency":"BNB_USDT"}]
*/

//@version=5
// strategy(title="Dow Theory Trend Strategy v3", shorttitle="Dow Trend Strat v3", overlay=true,
//      initial_capital=10000, default_qty_type=strategy.percent_of_equity, default_qty_value=10,
// commission_type=strategy.commission.percent, commission_value=0.1, // Example strategy settings with commission- 1