Stratégie d'oscillateur à lissage bipolaire

🎯 Quelle est cette stratégie magique ?
Vous savez quoi ? Cette stratégie fonctionne comme un « détecteur d’émotions » installé sur le marché ! 📡 Elle utilise un oscillateur à double lissage pour percevoir les « joies et les peines » du marché. Lorsque le marché devient trop euphorique (surachat) ou trop déprimé (survente), elle émet des signaux de trading. Point clé ! Ce n’est pas un oscillateur ordinaire, mais une version avancée « doublement retouchée » capable de filtrer efficacement le bruit du marché et de vous faire voir la véritable direction de la tendance.
💡 Décryptage du fonctionnement
Imaginez cette stratégie comme un « thermomètre de marché » ultra-sensible 🌡️. D’abord, elle calcule l’écart par rapport à une moyenne mobile à 25 périodes, puis le normalise (comme convertir des tailles différentes en proportions standard). Ensuite vient le processus crucial de « double lissage », comparable à l’application de deux filtres de retouche photo successifs, rendant le signal plus clair et plus fiable. Lorsque l’oscillateur franchit le seuil défini, la stratégie passe à l’action de manière décisive !
⚡ Les super-pouvoirs de cette stratégie
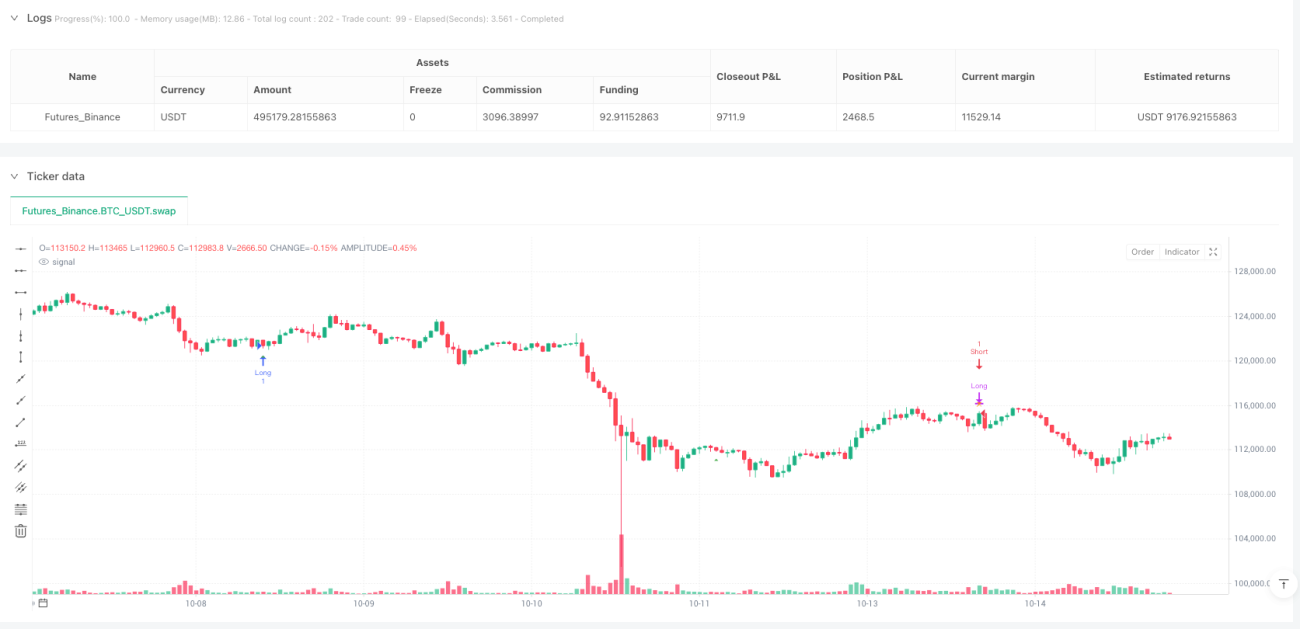
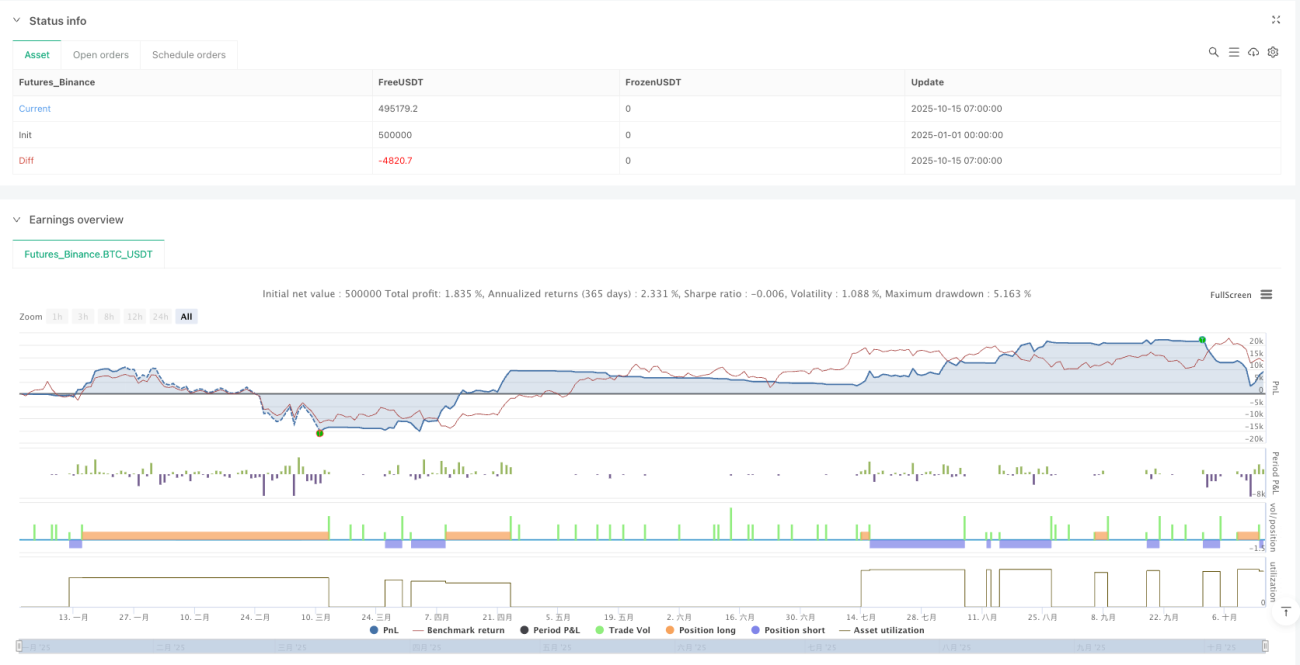
Voici le guide pour éviter les pièges ! Le point fort de cette stratégie est son mécanisme de « clôture sur signal inverse » – aussi intelligent que de freiner immédiatement devant un feu rouge ! 🚦 Dès qu’un signal opposé apparaît, la stratégie ferme la position sans s’obstiner. Elle dispose également d’un stop-loss fixe à 5 périodes, comme un « airbag » pour vos fonds. Le plus appréciable, c’est qu’elle intègre des fonctions complètes de statistiques de trading, vous permettant de suivre en permanence les performances de la stratégie !
🚨 Rappel des risques à ne pas négliger
Attention ! Bien que cette stratégie soit excellente, elle n’est pas infaillible. Sur des marchés fortement tendanciels, l’oscillateur peut « se perdre », un peu comme utiliser un GPS urbain sur une autoroute. Les seuils fixes peuvent s’avérer inadaptés selon les environnements de marché ; vous devrez les ajuster en fonction des conditions réelles. N’oubliez pas : toute stratégie doit être associée à une bonne gestion des risques. Ne mettez pas tous vos œufs dans le même panier !
- 1