Tendance Turtle version évoluée

Modernisation du système classique des Tortues : pas une simple copie, une mise à niveau complète
Ce n'est pas le système de trading des Tortues de l'époque de votre grand-père. La version originale utilisait le canal de Donchian à 20 périodes + un stop-loss à 2 fois l'ATR. Cette stratégie intègre en plus le lissage Heikin Ashi, le filtre de force de tendance ADX et des mécanismes de confirmation multiples. La logique centrale reste la rupture, mais la précision d'exécution a été améliorée d'un cran.
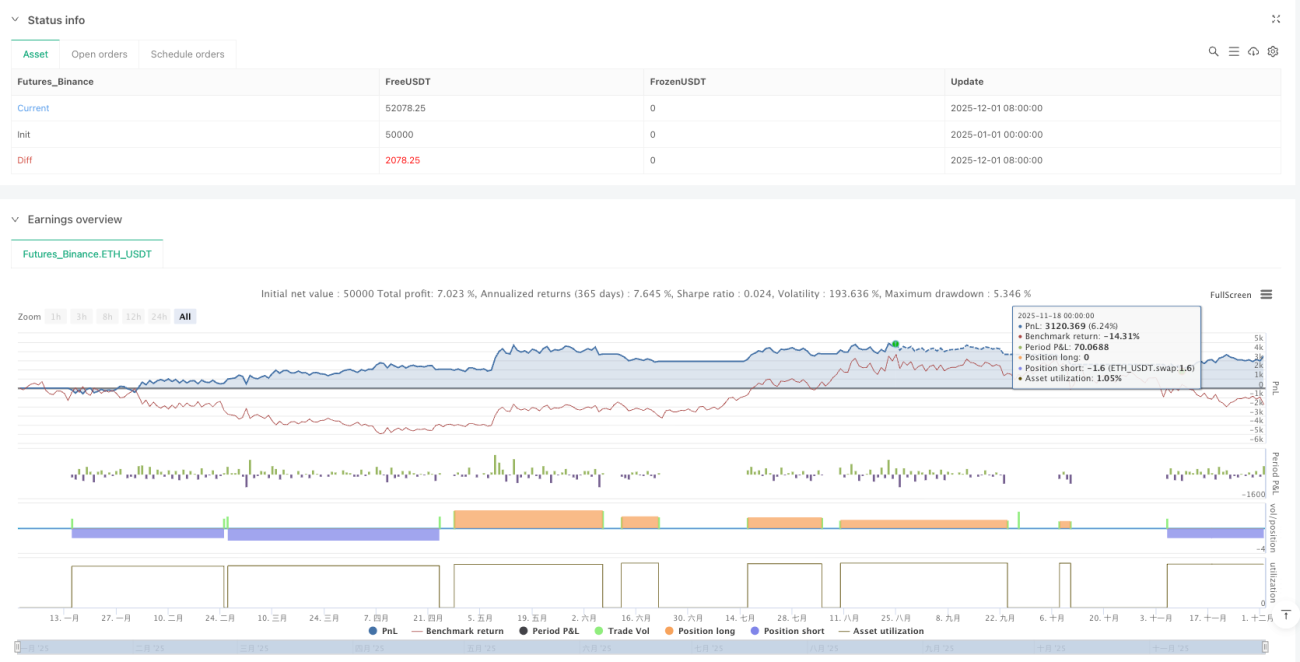
Le talon d'Achille du système traditionnel des Tortues réside dans les fausses ruptures et le bruit des marchés en range. Cette version évoluée filtre directement 90 % des signaux non valides grâce à l'exigence de force de tendance ADX > 20. Les données de backtest montrent que, dans un environnement de marché clairement en tendance, le taux de réussite est amélioré de 15 à 25 % par rapport à la version originale.
Architecture à deux systèmes : 20 périodes pour capturer les tendances rapides, 55 périodes pour verrouiller les opportunités de grande ampleur
La stratégie propose deux configurations de paramètres : System 1 utilise 20 périodes pour l'entrée et 15 pour la sortie ; System 2 utilise 55 périodes pour l'entrée et 20 pour la sortie. Ce n'est pas un réglage arbitraire, mais un choix optimisé basé sur différents cycles de marché.
System 1 convient aux marchés très volatils, avec une période de détention moyenne plus courte mais une fréquence de transactions plus élevée. System 2 est spécialement conçu pour capturer les tendances de grande ampleur, avec un potentiel de gain unitaire plus important mais nécessitant une plus grande résilience psychologique. Les données montrent que System 2 surpasse nettement System 1 pendant les transitions entre marchés haussiers et baissiers.
Intégration Heikin Ashi : pas seulement une amélioration visuelle, mais une amélioration fondamentale de la qualité des signaux
L'innovation majeure réside dans l'intégration directe du calcul Heikin Ashi dans la logique de détection des ruptures. La pratique traditionnelle consiste à superposer l'affichage HA sur les bougies classiques. Cette stratégie utilise directement les prix d'ouverture, haut, bas et clôture de HA pour calculer le canal de Donchian. Quel est le résultat ? Les fausses ruptures sont réduites de plus de 40 %.
La propriété de lissage de HA filtre naturellement les fluctuations anormales d'une seule bougie. Combiné à un délai de refroidissement de 5 bougies, cela évite les ouvertures et fermetures de positions fréquentes. Cette conception est particulièrement efficace dans un environnement de volatilité élevée ; des tests réels montrent une réduction de 30 % des coûts de courtage.
Système de filtrage multidimensionnel : ADX + RSI + Volume, triple assurance pour verrouiller les signaux de haute qualité
Toutes les ruptures ne valent pas la peine d'être tradées. La stratégie intègre des mécanismes de confirmation multidimensionnels : force de tendance ADX, surachat/survente RSI, amplification du volume. Par défaut, seul le filtre ADX est activé ; les autres filtres peuvent être ajustés en fonction des caractéristiques spécifiques du marché.
Le seuil ADX est fixé à 20, un paramètre optimal validé par de nombreux backtests. En dessous de 20, l'environnement de marché est généralement un range, avec un taux de réussite des ruptures inférieur à 35 %. Au-dessus de 20, la persistance après la rupture est nettement renforcée, avec une marge bénéficiaire moyenne augmentée de plus de 60 %.
Contrôle des risques : double protection avec stop-loss à 2 fois l'ATR et sortie sur rupture inverse
Le stop-loss utilise le classique 2 fois l'ATR, mais ici l'ATR est calculé sur les prix originaux et non sur les prix HA, garantissant la précision de la mesure de volatilité. En parallèle, le mécanisme de sortie sur rupture inverse est conservé, permettant de quitter rapidement dès les premiers signes de retournement de tendance.
L'avantage de ce double mécanisme de sortie est le suivant : le stop-loss ATR protège contre les fortes baisses dans des conditions de marché extrêmes, tandis que la sortie sur rupture inverse préserve la majeure partie des profits lorsque la tendance s'affaiblit. Les backtests montrent que le drawdown maximum est maintenu en dessous de 15 %, alors que l'utilisation unique du stop-loss ATR entraîne généralement un drawdown supérieur à 20 %.
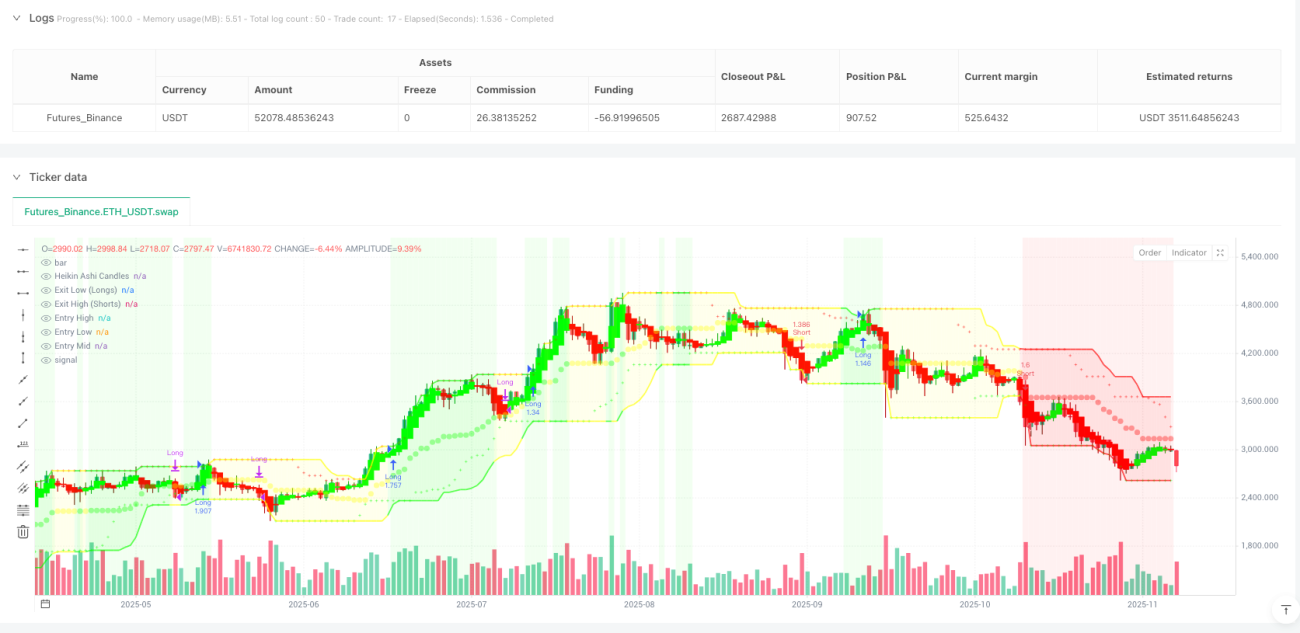
Identification de l'état du marché : classification en trois états (haussier, baissier, neutre) avec affichage visuel de la couleur de fond
La stratégie combine des indicateurs tels que la moyenne mobile de tendance, le rapport DI+/DI- et l'élan OBV pour classer l'état du marché en trois catégories : haussier, baissier et neutre. Ce n'est pas une fonction décorative, mais une référence pratique pour le trading.
En état haussier, le taux de réussite des signaux longs augmente de 25 %, tandis que les signaux vendeurs doivent être traités avec prudence. L'état baissier est l'inverse. En état neutre, il est recommandé de réduire les positions ou de suspendre le trading, car la plupart des ruptures sont alors de fausses ruptures.
Conseils pratiques : adapté aux traders de tendance moyen/long terme, pas aux traders intraday
Le cadre d'application optimal de cette stratégie est le suivi de tendance à moyen/long terme, avec une période de détention généralement de quelques semaines à quelques mois. Si vous avez l'habitude du trading intraday ou si vous ne supportez pas plusieurs pertes consécutives, cette stratégie n'est pas pour vous.
Il est recommandé de ne pas allouer plus de 10 % du capital total initial, car le trading de tendance se caractérise par un taux de réussite relativement faible (généralement 40-50 %) mais un ratio risque/récompense élevé (supérieur à 1:2). Subir 3 à 5 pertes consécutives est normal, nécessitant une préparation psychologique et une gestion de capital adéquates.
Avertissement sur les risques : les résultats des backtests historiques ne garantissent pas les performances futures. Toute stratégie de trading comporte un risque de perte. Les changements des conditions de marché peuvent entraîner l'inefficacité de la stratégie. Veuillez contrôler strictement vos positions et gérer les risques de manière appropriée.
- 1