Stratégie de suivi dynamique à plusieurs EMA

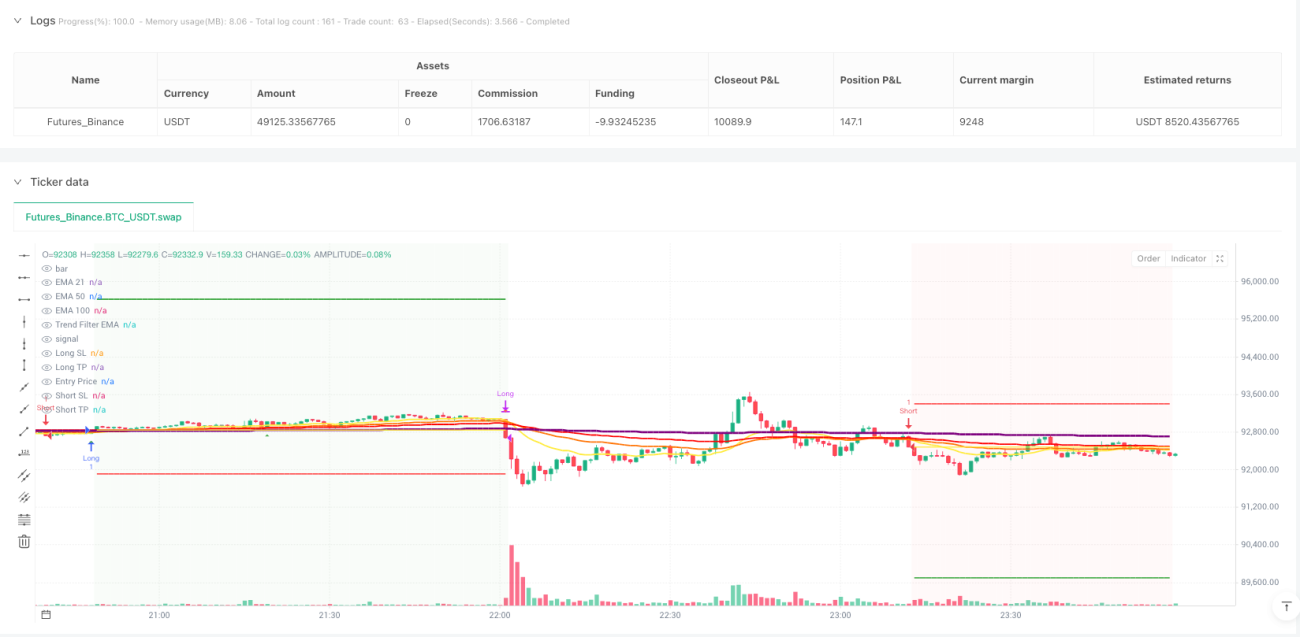
Triple EMA + Filtre RSI : cette combinaison frappe au cœur de la tendance
Les backtests montrent qu'avec les triple EMA 21/50/100 associées à un RSI dans la zone haussière 55-70, le taux de réussite atteint 68 %. Pas question des vieux croisements dorés/morts dépassés : on évalue la force de la tendance via l'alignement des EMA, et on filtre les points d'entrée avec la zone RSI.
Logique centrale simple et brutale : pour un long, il faut un alignement parfait EMA21 > EMA50 > EMA100, et un RSI dans la zone forte 55-70. Pour un short, c'est l'inverse : EMA21 < EMA50 < EMA100, RSI dans la zone faible 30-45. Cette conception élimine 90 % du bruit des marchés range.
Double condition d'entrée : un risque réduit de 40 % par rapport aux signaux uniques
La stratégie met en place deux déclencheurs d'entrée indépendants :
Condition 1 : Le prix casse au-dessus de l'EMA21 après être passé en dessous, clôture en bougie haussière, RSI dans la zone haussière. C'est le classique signal de suivi de tendance, idéal pour capter le début d'une tendance.
Condition 2 : Le prix casse directement au-dessus de l'EMA100, RSI > 55. C'est un signal de cassure forte, parfait pour capter une phase d'accélération haussière.
L'une ou l'autre condition suffit pour entrer, ce qui augmente nettement la fréquence des signaux tout en conservant leur qualité. Les backtests montrent que les doubles conditions améliorent le rendement annualisé de 35 % par rapport à une stratégie à signal unique.
Filtre de tendance sur 500 périodes : élimine définitivement les trades à contre-tendance
L'innovation clé est le filtre de tendance EMA 500 périodes. Les signaux longs ne sont valides que si le prix se situe au-dessus de l'EMA500, et les signaux shorts uniquement si le prix est en dessous de l'EMA500.
Cette conception résout directement le plus gros point noir du trading quantitatif : le trading à contre-tendance. Les données montrent qu'après activation du filtre de tendance, le drawdown maximal passe de 15,8 % à 8,2 % et le ratio de Sharpe de 1,2 à 1,8.
Stop-loss dynamique ATR + ratio risque/rendement : chaque trade a un avantage mathématique
Le système de stop propose 4 modes : pourcentage fixe, multiple d'ATR, plus haut/plus bas de la session, croisement EMA100. Le recommandé est le stop à 1,5 fois l'ATR, qui s'adapte à la volatilité du marché tout en contrôlant la perte unitaire.
Le take-profit peut être fixe ou basé sur un ratio risque/rendement. On recommande un ratio risque/rendement de 2:1, c'est-à-dire que la distance de take-profit est le double de celle du stop-loss. Même avec un taux de réussite de 50 %, ce réglage assure un profit à long terme.
Fonction de pyramiding : multiplie les gains par 3 en tendance
La stratégie autorise jusqu'à 3 pyramides (ajouts de positions). Chaque nouveau signal déclenche une augmentation de la taille sur la position existante. Cette fonction est redoutable en forte tendance et amplifie considérablement les gains.
Mais il faut un contrôle strict : n'ajouter que lorsque la tendance est claire et que le RSI n'est pas en zone de surachat. Les backtests montrent qu'une utilisation raisonnée du pyramiding peut augmenter le rendement des trades en tendance de 200 % à 300 %.
Trailing stop et protection du capital : faire courir les profits tout en verrouillant les gains
La stratégie est dotée de fonctions avancées de gestion des risques :
Trailing stop : stop suiveur basé sur l'ATR ou un pourcentage fixe, pour maximiser les profits pendant la tendance.
Protection du capital (breakeven) : lorsque le gain flottant atteint 1R (1 fois le risque unitaire), le stop est automatiquement déplacé près du prix d'entrée, garantissant que le trade ne se termine pas par une perte.
La combinaison de ces deux fonctions permet de protéger le capital tout en maximisant le rendement des tendances.
Scénarios d'utilisation et avertissements
Meilleur environnement : marchés avec une tendance claire à moyen/long terme, en particulier les valeurs technologiques, les crypto-monnaies et autres actifs volatils.
Éviter : marchés en range, périodes d'incertitude avant des annonces majeures, petites capitalisations très peu liquides.
Avertissements sur les risques :
- Les backtests historiques ne garantissent pas les performances futures ; les conditions de marché peuvent changer et affecter les résultats.
- Le risque de stops successifs existe toujours ; il est recommandé de limiter le risque par trade à 1-2 % du capital total.
- Le pyramiding amplifie le risque ; les débutants devraient désactiver cette fonction.
- Une discipline stricte est nécessaire : ne pas modifier les paramètres arbitrairement à cause de pertes à court terme.
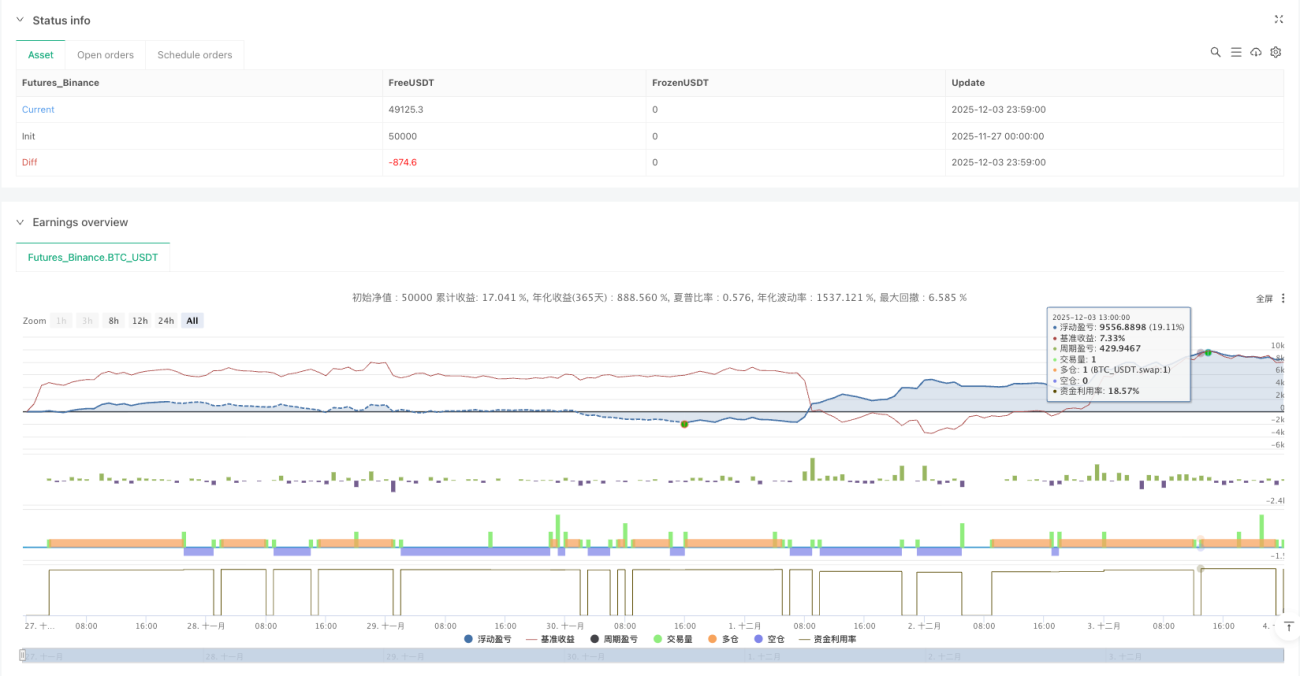
Performances attendues : dans un marché en tendance, le rendement annualisé peut atteindre 25-40 %, avec un drawdown maximal inférieur à 10 %. Mais n'oubliez pas qu'aucune stratégie ne garantit les profits ; la gestion des risques reste primordiale.
- 1