
0
Follow
0
Followers
बैक-टेस्टेड बाजार डेटा, बाजार चार्ट में मौजूद बाजार डेटा से अलग क्यों हैं?
Created 2018-04-20 17:36:57 Updated 2018-04-20 21:59:29
5
2018
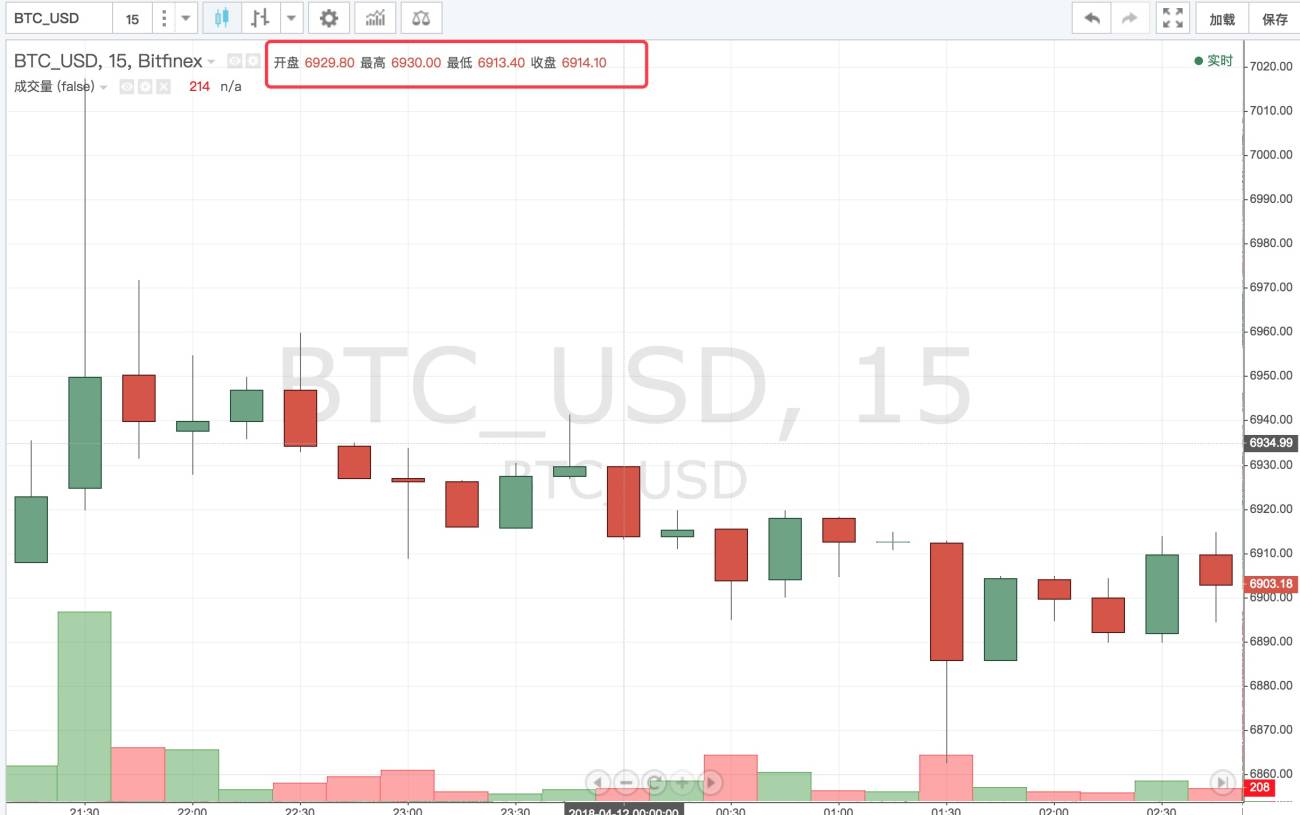
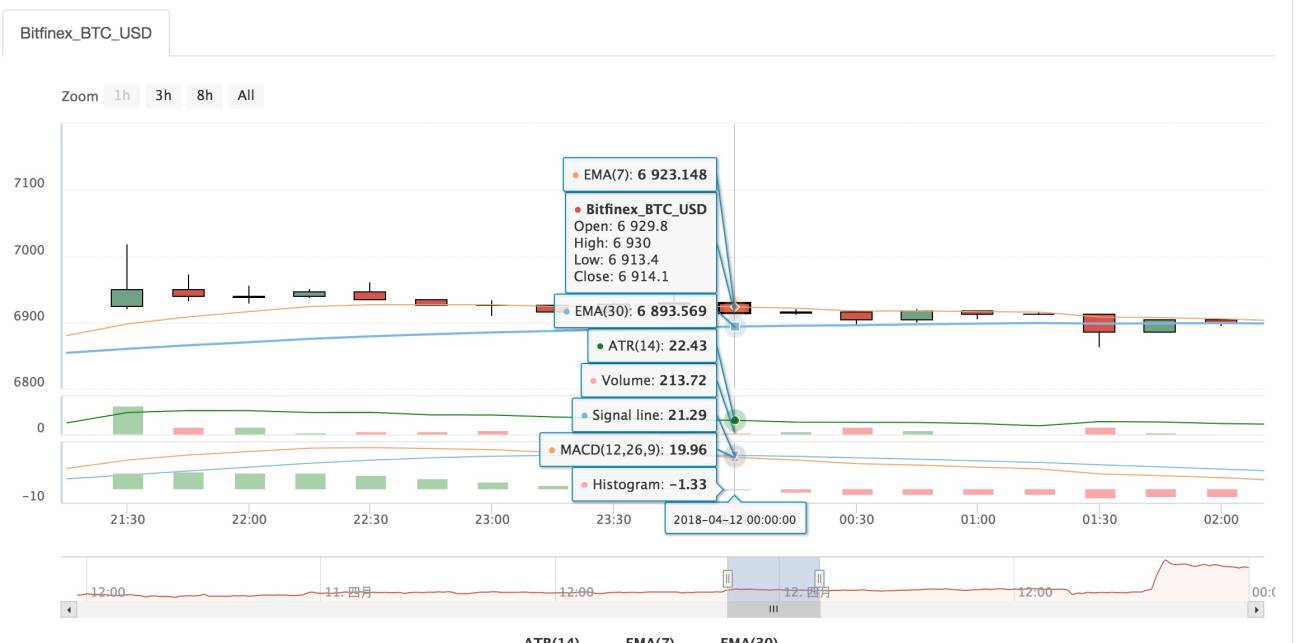
Bitfinex BTC USD के लिए भी ऐसा ही है, हर दिन K लाइन डेटा अलग है।
उदाहरण के लिए, 12 अप्रैल, 2018 की K लाइन, रिट्रेसमेंट में ट्रेंड डेटा का क्लोज 7639.2 है।
यह चार्ट वेबसाइट पर उपलब्ध है: https://quantinfo.com/Tools/View/4/chart.html
उस दिन का क्लोज 7912.0 था, और उसी दिन के आंकड़ों में 200 से अधिक अंतर था, कृपया पूछें कि कौन सा आंकड़ा सही है?
Related Recommendations
The grid trading strategyPython streamlined multi-variety MACD trending strategy frameworkin main TypeError: IO() takes at most 3 arguments (5 given)symbol not setGetTicker: 400: {"code": 2, "data": {}, "message": "invalid params"}gateio getdepth 502Decrypt: Secret key decrypt failedGetOrders: 400: {"code":-1121,"msg":"Invalid symbol."}HTTP 403 errorBitcoin trading by using bots
Comment
All comments (5)


- 1