
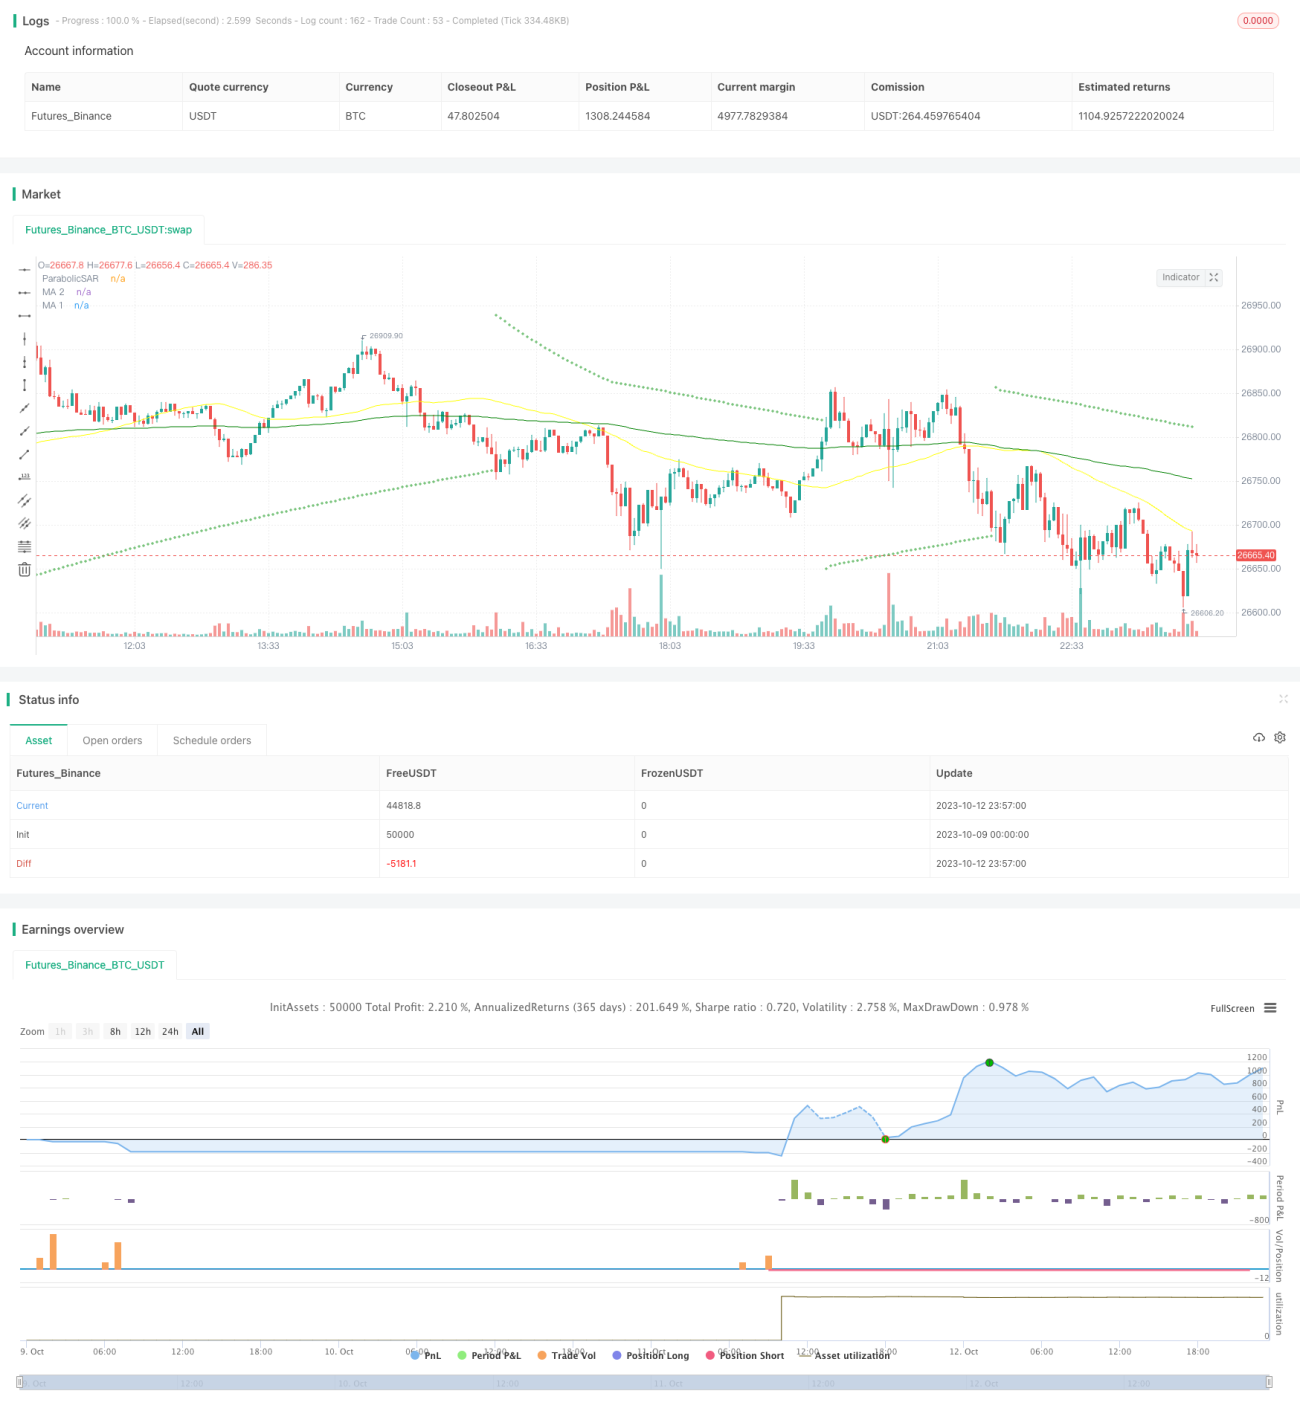
इस रणनीति में चार तत्वों की पहचान करने के लिए चार तत्वों का उपयोग किया जाता है, जिनमें सार्, आरएसआई, वोल और मा रेविन शामिल हैं, और एक मजबूत जोखिम प्रबंधन उपाय है जो रुझान को ट्रैक करता है। रणनीति को सार् के रूप में मुख्य रूप से लिया जाता है, आरएसआई ओवरबॉय ओवरसेलिंग सीमाएं रिवर्स सिग्नल की पहचान करने के लिए, वोल संकेत को लेनदेन की विशेषता के रूप में निर्धारित किया जाता है, और मा रेविन मुख्य प्रवृत्ति की दिशा को निर्धारित करता है। कई सूचक संयोजनों के माध्यम से, सिग्नल को फ़िल्टर किया जा सकता है और वास्तविक प्रवृत्ति की दिशा की पहचान की जा सकती है। जोखिम प्रबंधन को रोकना और रोकना, एकल हानि और संचयी लाभ को प्रभावी ढंग से नियंत्रित करना। यह रणनीति मध्यम-लंबी रेखा धारकों के लिए उपयुक्त है, जो मुख्यधारा के रुझानों के अनुरूप स्थिर आय प्राप्त कर सकती है।
इस रणनीति में चार प्रमुख तकनीकी मापदंडों का उपयोग किया गया हैः
Parabolic SAR: यह सूचक रुझान की दिशा और पलटाव के लिए बिंदुओं और रुझानों के बीच संबंधों का उपयोग करता है। बिंदुओं को कीमत के ऊपर होने पर उछाल दिया जाता है, और बिंदुओं को कीमत के नीचे होने पर गिरावट दी जाती है। जब बिंदुओं को कीमत के माध्यम से पार किया जाता है, तो रुझानों को उलट दिया जाता है। रणनीति को रुझान की दिशा के लिए मुख्य सूचक के रूप में उपयोग किया जाता है।
आरएसआईः एक अपेक्षाकृत मजबूत सूचक। यह सूचक 0-100 के बीच के उतार-चढ़ाव पर बाजार के ओवरबॉय और ओवरबॉय को निर्धारित करता है। आरएसआई 70 से ऊपर है, जो ओवरबॉय क्षेत्र है, 30 से नीचे है, जो ओवरबॉय क्षेत्र है, और 50 के आसपास वापस है, जो मध्य-रेखा क्षेत्र है। रणनीति आरएसआई के आधार पर ओवरबॉय और ओवरबॉय के लिए एक रिवर्स सिग्नल है।
VOL: लेन-देन मात्रा सूचक. रणनीति प्रवृत्ति की पुष्टि करने और उलटा संकेत की गुणवत्ता का न्याय करने के लिए लेन-देन मात्रा को बढ़ाने के लक्षणों को निर्धारित करने के लिए VOL का उपयोग करती है।
MA: चलती औसत रणनीति में, एक लंबी और एक छोटी औसत रेखा का उपयोग किया जाता है ताकि एक प्रमुख प्रवृत्ति की दिशा का पता लगाया जा सके एक लंबी और एक लंबी औसत रेखा को एक छोटी औसत रेखा के ऊपर से गुजरना एक अधिक संकेत है, और एक लंबी और एक लंबी औसत रेखा को एक कम संकेत के नीचे से गुजरना
ट्रेडिंग सिग्नल जनरेशन नियम:
मल्टी हेड कंडीशनः एसएआर बिंदु के लाइन के नीचे बदल गया और आरएसआई नीचे से ऊपर की ओर उछाल के साथ मध्य रेखा क्षेत्र में प्रवेश किया, वीओएल विशेषता को स्पष्ट रूप से बढ़ाया गया, लघु औसत रेखा नीचे से ऊपर की ओर लंबी औसत रेखा से गुजरती है।
शून्य स्थिति: एसएआर बिंदु के लाइन से ऊपर की ओर जाता है और आरएसआई ऊपर से नीचे की ओर मध्य रेखा क्षेत्र में जाता है, वीओएल विशेषता स्पष्ट रूप से बढ़ जाती है, लघु औसत रेखा ऊपर से नीचे की ओर लंबी औसत रेखा से गुजरती है।
इस रणनीति में स्टॉप-स्टॉप-लॉस जोखिम प्रबंधन नियम भी हैं। स्टॉप-स्टॉप का लक्ष्य प्रवेश मूल्य का 2 गुना है, और स्टॉप-लॉस का मूल्य प्रवेश मूल्य का 0.8 गुना है, जो प्रभावी रूप से मुनाफे को लॉक करने और जोखिम को नियंत्रित करने के लिए है।
इस रणनीति के निम्नलिखित फायदे हैं:
बहु-सूचक संयोजन डिजाइन झूठे संकेतों से बचने के लिए और वास्तविक रुझान मोड़ को पकड़ने के लिए।
जोखिम प्रबंधन सेटिंग्स स्टॉप लॉस स्टॉप, प्रभावी जोखिम नियंत्रण
स्टॉकिंग्स का प्रबंधन स्टॉकिंग्स में प्रवेश करने और स्टॉकिंग्स को बंद करने के लिए है, ताकि लाभ को अधिकतम किया जा सके।
बार-बार अनुकूलित परीक्षण के बाद, पैरामीटर स्थिरता की गारंटी देता है।
वास्तविक लेनदेन के माहौल का अनुकरण करने के लिए पर्याप्त डेटा प्राप्त करें।
ऑपरेशन तर्क स्पष्ट और सरल है, और इसे लागू करना आसान है।
इस रणनीति में निम्नलिखित जोखिम भी हैं:
बाजार में असामान्य उतार-चढ़ाव के कारण स्टॉप लॉस को तोड़ दिया गया। उचित स्टॉप लॉस दूरी को शिफारस की जाती है।
लेन-देन की कम तरलता के कारण नुकसान को रोकना असंभव है। लेन-देन की अच्छी तरलता का चयन किया जाना चाहिए।
प्रणालीगत जोखिम के कारण असामान्य उछाल। लीवरेज को कम किया जाना चाहिए और अच्छी मूल्य आधार वाली संपत्ति होनी चाहिए।
पैरामीटर के अति-अनुकूलन के परिणामस्वरूप वक्र बहुत सुंदर हो जाता है। स्थिरता बढ़ाने के लिए पैरामीटर को उचित रूप से कमजोर किया जाना चाहिए।
अत्यधिक ट्रेडिंग आवृत्ति के कारण स्लाइड पॉइंट लागत। ट्रेडिंग सिग्नल जनरेशन अंतराल को उचित रूप से छूट दी जा सकती है।
सिग्नल प्रभाव कमजोर हो जाता है और समय पर अद्यतन की आवश्यकता होती है। पैरामीटर सेटिंग्स को समय-समय पर वापस और अनुकूलित किया जाना चाहिए।
इस रणनीति को और भी बेहतर बनाया जा सकता है:
बेहतर मिलान के लिए MACD, KD, आदि जैसे अधिक सूचक संयोजनों का परीक्षण करें।
अनुकूलित एमए चक्र पैरामीटर सेटिंग्स मुख्य प्रवृत्ति को अधिक स्पष्ट रूप से पहचानने के लिए
स्टॉप लॉस को ऑप्टिमाइज़ करें ताकि आपको सबसे अच्छा रिस्क-टू-रिटर्न अनुपात मिल सके।
विभिन्न किस्मों के मापदंडों की शक्ति का परीक्षण करें और सर्वोत्तम संयोजन खोजें।
ट्रेडिंग सिग्नल का आकलन करने के लिए मशीन लर्निंग मॉडल जोड़ना।
स्टॉप लॉस को वास्तविक उतार-चढ़ाव के करीब लाने के लिए अनुकूलनशील स्टॉप लॉस एल्गोरिदम जोड़े गए हैं।
परीक्षण लंबी अवधि के लिए पैरामीटर सेट करें, रोक सीमा का विस्तार करें
इस रणनीति का व्यापक रूप से प्रवृत्ति की दिशा निर्धारित करने के लिए झूठे संकेतों को फ़िल्टर करने के लिए कई संकेतकों का उपयोग किया जाता है, जोखिम को नियंत्रित करने के लिए स्टॉप लॉस रोकथाम की स्थापना की जाती है, और पैरामीटर अनुकूलन और पोर्टफोलियो समायोजन के माध्यम से रणनीति की प्रभावशीलता को लगातार बढ़ाया जाता है। हालांकि कोई भी रणनीति भविष्य की भविष्यवाणी करने में सक्षम नहीं है, लेकिन अच्छी तरह से जोखिम प्रबंधन के साथ सिस्टम की ट्रेडिंग योजना मुनाफे की संभावना को काफी बढ़ाएगी। यह रणनीति एक अपेक्षाकृत मजबूत प्रवृत्ति ट्रैकिंग कार्यक्रम प्रदान करती है, जो लंबे समय तक स्थिर रिटर्न की तलाश करने वाले निवेशकों के लिए उचित है।
/*backtest
start: 2023-10-09 00:00:00
end: 2023-10-13 00:00:00
period: 3m
basePeriod: 1m
exchanges: [{"eid":"Futures_Binance","currency":"BTC_USDT"}]
*/
// This source code is subject to the terms of the Mozilla Public License 2.0 at https://mozilla.org/MPL/2.0/
// © myn
//@version=5
strategy('Strategy Myth-Busting #6 - PSAR+MA+SQZMOM+HVI - [MYN]', max_bars_back=5000, overlay=true, pyramiding=0, initial_capital=20000, currency='USD', default_qty_type=strategy.percent_of_equity, default_qty_value=100.0, commission_value=0.075, use_bar_magnifier = false)
/////////////////////////////////////
//* Put your strategy logic below *//
/////////////////////////////////////
// dOg28adjYWY
//Trading Strategies Used
// Parabolic Sar
// 10 in 1 MA's
// Squeeze Momentum
// HawkEYE Volume Indicator
// Long Condition
// Parabolic Sar shift below price at last dot above and then previous bar needs to breach above that.
// Price action has to be below both MA's and 50MA needs to be above 200MA
// Squeeze Momentum needsd to be in green or close to going green
// HawkEYE Volume Indicator needs to be show a green bar on the histagram
// Short Condition
// Parabolic Sar shift above price at last dot below and then previous bar needs to breach below that.
// Price action needs to be above both MA's and 50MA needs to be below 200MA
// Squeeze Momentum needsd to be in red or close to going red
// HawkEYE Volume Indicator needs to be show a red bar on the histagram
// Parabolic SAR
//░░░░░░░░░░░░░░░░░░░░░░░░░░░░░░░░░░░░░░░░░░░░░░░░░░░░░░░░░░░░░░░░░░░░░░░░░░░░░░░░░░░░░░░░░░░░░░░░░░░░░░░░░░░░░░░░░░░░░░░░░░░░░░░░░░░░░░░░░░░░░░░░░░
//@version=5
//indicator(title="Parabolic SAR", shorttitle="SAR", overlay=true, timeframe="", timeframe_gaps=true)
// Dynamic Max based on trendcode
int TrendCodeAdaptive = switch timeframe.multiplier
1 => 1
3 => 1
5 => 1
10 => 2
15 => 3
30 => 5
45 => 5
60 => 7
120 => 9
180 => 9
240 => 13
300 => 14
360 => 15
=>
int(4)
bool overrideAdaptiveSar = input(false, title="Override Adaptive PSAR", group="Adaptive Parabolic Sar")
TrendCodeOverRide = input(5, title='Trend Code (If Overriding Adaptive PSAR)')
startPSAR = 0.02
increment = 0.02
maximum = overrideAdaptiveSar ? TrendCodeOverRide * 0.005 : TrendCodeAdaptive * 0.005
PSAR = ta.sar(startPSAR, increment, maximum)
plot(PSAR, "ParabolicSAR", style=plot.style_cross, color=color.green)
//PSARLongEntry = PSAR < close ? 1 : na
//PSARShortEntry = PSAR < close ? na : -1
PSARLongEntry = high < PSAR and barstate.isconfirmed
PSARShortEntry = low > PSAR and barstate.isconfirmed
// Squeeze Momentum
//░░░░░░░░░░░░░░░░░░░░░░░░░░░░░░░░░░░░░░░░░░░░░░░░░░░░░░░░░░░░░░░░░░░░░░░░░░░░░░░░░░░░░░░░░░░░░░░░░░░░░░░░░░░░░░░░░░░░░░░░░░░░░░░░░░░░░░░░░░░░░░░░░░
//@version=5
// @author LazyBear
// List of all my indicators: https://www.tradingview.com/v/4IneGo8h/
//
//indicator(shorttitle='SQZMOM_LB', title='Squeeze Momentum Indicator [LazyBear]', overlay=false)
lengthBB = input(20, title='BB Length', group="Squeeze Momentum")
mult = input(2.0, title='BB MultFactor')
lengthKC = input(20, title='KC Length')
multKC = input(1.5, title='KC MultFactor')
useTrueRange = input(true, title='Use TrueRange (KC)')
// Calculate BB
source = close
basis = ta.sma(source, lengthBB)
dev = multKC * ta.stdev(source, lengthBB)
upperBB = basis + dev
lowerBB = basis - dev
// Calculate KC
ma = ta.sma(source, lengthKC)
range_1 = useTrueRange ? ta.tr : high - low
rangema = ta.sma(range_1, lengthKC)
upperKC = ma + rangema * multKC
lowerKC = ma - rangema * multKC
sqzOn = lowerBB > lowerKC and upperBB < upperKC
sqzOff = lowerBB < lowerKC and upperBB > upperKC
noSqz = sqzOn == false and sqzOff == false
val = ta.linreg(source - math.avg(math.avg(ta.highest(high, lengthKC), ta.lowest(low, lengthKC)), ta.sma(close, lengthKC)), lengthKC, 0)
iff_1 = val > nz(val[1]) ? color.lime : color.green
iff_2 = val < nz(val[1]) ? color.red : color.maroon
bcolor = val > 0 ? iff_1 : iff_2
scolor = noSqz ? color.blue : sqzOn ? color.black : color.gray
//plot(val, color=bcolor, style=plot.style_histogram, linewidth=4)
//plot(0, color=scolor, style=plot.style_cross, linewidth=2)
SQZMOMLongEntry = val > 0
SQZMOMShortEntry = val < 0
// 10 in 1 Different Moving Averages
//░░░░░░░░░░░░░░░░░░░░░░░░░░░░░░░░░░░░░░░░░░░░░░░░░░░░░░░░░░░░░░░░░░░░░░░░░░░░░░░░░░░░░░░░░░░░░░░░░░░░░░░░░░░░░░░░░░░░░░░░░░░░░░░░░░░░░░░░░░░░░░░░░░
// © hiimannshu
//@version=5
// This indicator is just a simple indicator which plot any kind of multiple (atmost 10) moving everage (sma/ema/wma/rma/hma/vwma) on chart.
// Enjoy the new update
//indicator(title='10 in 1 Different Moving Averages ( SMA/EMA/WMA/RMA/HMA/VWMA )', shorttitle=' 10 in 1 MAs', overlay=true)
bool plot_ma_1 = input.bool(true, '', inline='MA 1',group= "Multi Timeframe Moving Averages")
string ma_1_type = input.string(defval='EMA', title='MA 1', options=['RMA', 'SMA', 'EMA', 'WMA','HMA','VWMA'], inline='MA 1',group= "Multi Timeframe Moving Averages")
int ma_1_val = input.int(200, '', minval=1, inline='MA 1',group= "Multi Timeframe Moving Averages")
ma1_tf = input.timeframe(title='', defval='', inline='MA 1',group= "Multi Timeframe Moving Averages")
color ma_1_colour = input.color(color.green, '', inline='MA 1',group= "Multi Timeframe Moving Averages")
bool plot_ma_2 = input.bool(true, '', inline='MA 2',group= "Multi Timeframe Moving Averages")
string ma_2_type = input.string(defval='SMA', title='MA 2 ', options=['RMA', 'SMA', 'EMA', 'WMA','HMA','VWMA'], inline='MA 2',group= "Multi Timeframe Moving Averages")
int ma_2_val = input.int(50, '', minval=1, inline='MA 2',group= "Multi Timeframe Moving Averages")
ma2_tf = input.timeframe(title='', defval='', inline='MA 2',group= "Multi Timeframe Moving Averages")
color ma_2_colour = input.color(color.yellow, '', inline='MA 2',group= "Multi Timeframe Moving Averages")
bool plot_ma_3 = input.bool(false, '', inline='MA 3',group= "Multi Timeframe Moving Averages")
string ma_3_type = input.string(defval='SMA', title='MA 3 ', options=['RMA', 'SMA', 'EMA', 'WMA','HMA','VWMA'], inline='MA 3',group= "Multi Timeframe Moving Averages")
int ma_3_val = input.int(1, '', minval=1, inline='MA 3',group= "Multi Timeframe Moving Averages")
ma3_tf = input.timeframe(title='', defval='', inline='MA 3',group= "Multi Timeframe Moving Averages")
color ma_3_colour = input.color(color.black, '', inline='MA 3',group= "Multi Timeframe Moving Averages")
bool plot_ma_4 = input.bool(false, '', inline='MA 4',group= "Multi Timeframe Moving Averages")
string ma_4_type = input.string(defval='SMA', title='MA 4 ', options=['RMA', 'SMA', 'EMA', 'WMA','HMA','VWMA'], inline='MA 4',group= "Multi Timeframe Moving Averages")
int ma_4_val = input.int(1, '', minval=1, inline='MA 4',group= "Multi Timeframe Moving Averages")
ma4_tf = input.timeframe(title='', defval='', inline='MA 4',group= "Multi Timeframe Moving Averages")
color ma_4_colour = input.color(color.black, '', inline='MA 4',group= "Multi Timeframe Moving Averages")
bool plot_ma_5 = input.bool(false, '', inline='MA 5',group= "Multi Timeframe Moving Averages")
string ma_5_type = input.string(defval='SMA', title='MA 5 ', options=['RMA', 'SMA', 'EMA', 'WMA','HMA','VWMA'], inline='MA 5',group= "Multi Timeframe Moving Averages")
int ma_5_val = input.int(1, '', minval=1, inline='MA 5',group= "Multi Timeframe Moving Averages")
ma5_tf = input.timeframe(title='', defval='', inline='MA 5',group= "Multi Timeframe Moving Averages")
color ma_5_colour = input.color(color.black, '', inline='MA 5',group= "Multi Timeframe Moving Averages")
bool plot_ma_6 = input.bool(false, '', inline='MA 6',group= "Normal Moving Averages")
string ma_6_type = input.string(defval='SMA', title='MA 6 ', options=['RMA', 'SMA', 'EMA', 'WMA','HMA','VWMA'], inline='MA 6',group= "Normal Moving Averages")
int ma_6_val = input.int(1, '', minval=1, inline='MA 6',group= "Normal Moving Averages")
ma_6_src = input.source(defval=close, title='', inline='MA 6',group= "Normal Moving Averages")
color ma_6_colour = input.color(color.black, '', inline='MA 6',group= "Normal Moving Averages")
bool plot_ma_7 = input.bool(false, '', inline='MA 7',group= "Normal Moving Averages")
string ma_7_type = input.string(defval='SMA', title='MA 7 ', options=['RMA', 'SMA', 'EMA', 'WMA','HMA','VWMA'], inline='MA 7',group= "Normal Moving Averages")
int ma_7_val = input.int(1, '', minval=1, inline='MA 7',group= "Normal Moving Averages")
ma_7_src = input.source(defval=close, title='', inline='MA 7',group= "Normal Moving Averages")
color ma_7_colour = input.color(color.black, '', inline='MA 7',group= "Normal Moving Averages")
bool plot_ma_8 = input.bool(false, '', inline='MA 8',group= "Normal Moving Averages")
string ma_8_type = input.string(defval='SMA', title='MA 8', options=['RMA', 'SMA', 'EMA', 'WMA','HMA','VWMA'], inline='MA 8',group= "Normal Moving Averages")
int ma_8_val = input.int(1, '', minval=1, inline='MA 8',group= "Normal Moving Averages")
ma_8_src = input.source(defval=close, title='', inline='MA 8',group= "Normal Moving Averages")
color ma_8_colour = input.color(color.black, '', inline='MA 8',group= "Normal Moving Averages")
bool plot_ma_9 = input.bool(false, '', inline='MA 9',group= "Normal Moving Averages")
string ma_9_type = input.string(defval='SMA', title='MA 9 ', options=['RMA', 'SMA', 'EMA', 'WMA','HMA','VWMA'], inline='MA 9',group= "Normal Moving Averages")
int ma_9_val = input.int(1, '', minval=1, inline='MA 9',group= "Normal Moving Averages")
ma_9_src = input.source(defval=close, title='', inline='MA 9',group= "Normal Moving Averages")
color ma_9_colour = input.color(color.black, '', inline='MA 9',group= "Normal Moving Averages")
bool plot_ma_10 = input.bool(false, '', inline='MA 10',group= "Normal Moving Averages")
string ma_10_type = input.string(defval='SMA', title='MA 10', options=['RMA', 'SMA', 'EMA', 'WMA','HMA','VWMA'], inline='MA 10',group= "Normal Moving Averages")
int ma_10_val = input.int(1, '', minval=1, inline='MA 10',group= "Normal Moving Averages")
ma_10_src = input.source(defval=close, title='', inline='MA 10',group= "Normal Moving Averages")
color ma_10_colour = input.color(color.black, '', inline='MA 10',group= "Normal Moving Averages")
ma_function(source, length, type) =>
if type == 'RMA'
ta.rma(source, length)
else if type == 'SMA'
ta.sma(source, length)
else if type == 'EMA'
ta.ema(source, length)
else if type == 'WMA'
ta.wma(source, length)
else if type == 'HMA'
if(length<2)
ta.hma(source,2)
else
ta.hma(source, length)
else
ta.vwma(source, length)
ma_1 = plot_ma_1 ? request.security(syminfo.tickerid, ma1_tf, ma_function(close, ma_1_val, ma_1_type)):0
ma_2 = plot_ma_2 ?request.security(syminfo.tickerid, ma2_tf, ma_function(close, ma_2_val, ma_2_type)):0
ma_3 = plot_ma_3 ?request.security(syminfo.tickerid, ma3_tf, ma_function(close, ma_3_val, ma_3_type)):0
ma_4 = plot_ma_4 ? request.security(syminfo.tickerid, ma4_tf, ma_function(close, ma_4_val, ma_4_type)):0
ma_5 = plot_ma_5 ?request.security(syminfo.tickerid, ma5_tf, ma_function(close, ma_5_val, ma_5_type)):0
ma_6 = plot_ma_6 ?ma_function(ma_6_src, ma_6_val, ma_6_type):0
ma_7 = plot_ma_7 ?ma_function(ma_7_src, ma_7_val, ma_7_type):0
ma_8 = plot_ma_8 ?ma_function(ma_8_src, ma_8_val, ma_8_type):0
ma_9 = plot_ma_9 ?ma_function(ma_9_src, ma_9_val, ma_9_type):0
ma_10 = plot_ma_10 ?ma_function(ma_10_src, ma_10_val, ma_10_type):0
plot(plot_ma_1 ? ma_1 : na, 'MA 1', ma_1_colour)
plot(plot_ma_2 ? ma_2 : na, 'MA 2', ma_2_colour)
plot(plot_ma_3 ? ma_3 : na, 'MA 3', ma_3_colour)
plot(plot_ma_4 ? ma_4 : na, 'MA 4', ma_4_colour)
plot(plot_ma_5 ? ma_5 : na, 'MA 5', ma_5_colour)
plot(plot_ma_6 ? ma_6 : na, 'MA 6', ma_6_colour)
plot(plot_ma_7 ? ma_7 : na, 'MA 7', ma_7_colour)
plot(plot_ma_8 ? ma_8 : na, 'MA 8', ma_8_colour)
plot(plot_ma_9 ? ma_9 : na, 'MA 9', ma_9_colour)
plot(plot_ma_10 ? ma_10 : na, 'MA 10', ma_10_colour)
// Long entry - Price has to be below both MA's and 50MA needs to be above 200MA
MALongEntry = (close > ma_1 and close > ma_2) and (ma_2 > ma_1)
// Short Entry - Price has to be above both MA's and 50MA needs to be below 200MA
MAShortEntry = (close < ma_1 and close < ma_2) and (ma_2 < ma_1)
// HawkEYE Volume Indicator
//░░░░░░░░░░░░░░░░░░░░░░░░░░░░░░░░░░░░░░░░░░░░░░░░░░░░░░░░░░░░░░░░░░░░░░░░░░░░░░░░░░░░░░░░░░░░░░░░░░░░░░░░░░░░░░░░░░░░░░░░░░░░░░░░░░░░░░░░░░░░░░░░░░
//@version=5
// @author LazyBear
// If you use this code, in its original or modified form, do drop me a note. Thx.
//
//indicator('HawkEye Volume Indicator [LazyBear]', shorttitle='HVI_LB')
lengthhvi = input(200, group="HawkEye Volume Indicator")
range_1HVI = high - low
rangeAvg = ta.sma(range_1HVI, lengthhvi)
volumeA = ta.sma(volume, lengthhvi)
divisor = input(1)
high1 = high[1]
low1 = low[1]
mid1 = hl2[1]
u1 = mid1 + (high1 - low1) / divisor
d1 = mid1 - (high1 - low1) / divisor
r_enabled1 = range_1HVI > rangeAvg and close < d1 and volume > volumeA
r_enabled2 = close < mid1
r_enabled = r_enabled1 or r_enabled2
g_enabled1 = close > mid1
g_enabled2 = range_1HVI > rangeAvg and close > u1 and volume > volumeA
g_enabled3 = high > high1 and range_1HVI < rangeAvg / 1.5 and volume < volumeA
g_enabled4 = low < low1 and range_1HVI < rangeAvg / 1.5 and volume > volumeA
g_enabled = g_enabled1 or g_enabled2 or g_enabled3 or g_enabled4
gr_enabled1 = range_1HVI > rangeAvg and close > d1 and close < u1 and volume > volumeA and volume < volumeA * 1.5 and volume > volume[1]
gr_enabled2 = range_1HVI < rangeAvg / 1.5 and volume < volumeA / 1.5
gr_enabled3 = close > d1 and close < u1
gr_enabled = gr_enabled1 or gr_enabled2 or gr_enabled3
v_color = gr_enabled ? color.gray : g_enabled ? color.green : r_enabled ? color.red : color.blue
//plot(volume, style=plot.style_histogram, color=v_color, linewidth=5)
HVILongEntry = g_enabled
HVIShortEntry = r_enabled
//////////////////////////////////////
//* Put your strategy rules below *//
/////////////////////////////////////
longCondition = PSARLongEntry and MALongEntry and HVILongEntry and SQZMOMLongEntry
shortCondition = PSARShortEntry and MAShortEntry and HVIShortEntry and SQZMOMShortEntry
//define as 0 if do not want to use
closeLongCondition = 0
closeShortCondition = 0
// ADX
//░░░░░░░░░░░░░░░░░░░░░░░░░░░░░░░░░░░░░░░░░░░░░░░░░░░░░░░░░░░░░░░░░░░░░░░░░░░░░░░░░░░░░░░░░░░░░░░░░░░░░░░░░░░░░░░░░░░░░░░░░░░░░░░░░░░░░░░░░░░░░░░░░░
adxEnabled = input.bool(defval = false , title = "Average Directional Index (ADX)", tooltip = "", group ="ADX" )
adxlen = input(14, title="ADX Smoothing", group="ADX")
adxdilen = input(14, title="DI Length", group="ADX")
adxabove = input(25, title="ADX Threshold", group="ADX")
adxdirmov(len) =>
adxup = ta.change(high)
adxdown = -ta.change(low)
adxplusDM = na(adxup) ? na : (adxup > adxdown and adxup > 0 ? adxup : 0)
adxminusDM = na(adxdown) ? na : (adxdown > adxup and adxdown > 0 ? adxdown : 0)
adxtruerange = ta.rma(ta.tr, len)
adxplus = fixnan(100 * ta.rma(adxplusDM, len) / adxtruerange)
adxminus = fixnan(100 * ta.rma(adxminusDM, len) / adxtruerange)
[adxplus, adxminus]
adx(adxdilen, adxlen) =>
[adxplus, adxminus] = adxdirmov(adxdilen)
adxsum = adxplus + adxminus
adx = 100 * ta.rma(math.abs(adxplus - adxminus) / (adxsum == 0 ? 1 : adxsum), adxlen)
adxsig = adxEnabled ? adx(adxdilen, adxlen) : na
isADXEnabledAndAboveThreshold = adxEnabled ? (adxsig > adxabove) : true
//Backtesting Time Period (Input.time not working as expected as of 03/30/2021. Giving odd start/end dates
//░░░░░░░░░░░░░░░░░░░░░░░░░░░░░░░░░░░░░░░░░░░░░░░░░░░░░░░░░░░░░░░░░░░░░░░░░░░░░░░░░░░░░░░░░░░░░░░░░░░░░░░░░░░░░░░░░░░░░░░░░░░░░░░░░░░░░░░░░░░░░░░░░░
useStartPeriodTime = input.bool(true, 'Start', group='Date Range', inline='Start Period')
startPeriodTime = input(timestamp('1 Jan 2019'), '', group='Date Range', inline='Start Period')
useEndPeriodTime = input.bool(true, 'End', group='Date Range', inline='End Period')
endPeriodTime = input(timestamp('31 Dec 2030'), '', group='Date Range', inline='End Period')
start = useStartPeriodTime ? startPeriodTime >= time : false
end = useEndPeriodTime ? endPeriodTime <= time : false
calcPeriod = true
// Trade Direction
// ░░░░░░░░░░░░░░░░░░░░░░░░░░░░░░░░░░░░░░░░░░░░░░░░░░░░░░░░░░░░░░░░░░░░░░░░░░░░░░░░░░░░░░░░░░░░░░░░░░░░░░░░░░░░░░░░░░░░░░░░░░░░░░░░░░░░░░░░░░░░░░░░░░
tradeDirection = input.string('Long and Short', title='Trade Direction', options=['Long and Short', 'Long Only', 'Short Only'], group='Trade Direction')
// Percent as Points
// ░░░░░░░░░░░░░░░░░░░░░░░░░░░░░░░░░░░░░░░░░░░░░░░░░░░░░░░░░░░░░░░░░░░░░░░░░░░░░░░░░░░░░░░░░░░░░░░░░░░░░░░░░░░░░░░░░░░░░░░░░░░░░░░░░░░░░░░░░░░░░░░░░░
per(pcnt) =>
strategy.position_size != 0 ? math.round(pcnt / 100 * strategy.position_avg_price / syminfo.mintick) : float(na)
// Take profit 1
// ░░░░░░░░░░░░░░░░░░░░░░░░░░░░░░░░░░░░░░░░░░░░░░░░░░░░░░░░░░░░░░░░░░░░░░░░░░░░░░░░░░░░░░░░░░░░░░░░░░░░░░░░░░░░░░░░░░░░░░░░░░░░░░░░░░░░░░░░░░░░░░░░░░
tp1 = input.float(title='Take Profit 1 - Target %', defval=100, minval=0.0, step=0.5, group='Take Profit', inline='Take Profit 1')
q1 = input.int(title='% Of Position', defval=100, minval=0, group='Take Profit', inline='Take Profit 1')
// Take profit 2
// ░░░░░░░░░░░░░░░░░░░░░░░░░░░░░░░░░░░░░░░░░░░░░░░░░░░░░░░░░░░░░░░░░░░░░░░░░░░░░░░░░░░░░░░░░░░░░░░░░░░░░░░░░░░░░░░░░░░░░░░░░░░░░░░░░░░░░░░░░░░░░░░░░░
tp2 = input.float(title='Take Profit 2 - Target %', defval=100, minval=0.0, step=0.5, group='Take Profit', inline='Take Profit 2')
q2 = input.int(title='% Of Position', defval=100, minval=0, group='Take Profit', inline='Take Profit 2')
// Take profit 3
// ░░░░░░░░░░░░░░░░░░░░░░░░░░░░░░░░░░░░░░░░░░░░░░░░░░░░░░░░░░░░░░░░░░░░░░░░░░░░░░░░░░░░░░░░░░░░░░░░░░░░░░░░░░░░░░░░░░░░░░░░░░░░░░░░░░░░░░░░░░░░░░░░░░
tp3 = input.float(title='Take Profit 3 - Target %', defval=100, minval=0.0, step=0.5, group='Take Profit', inline='Take Profit 3')
q3 = input.int(title='% Of Position', defval=100, minval=0, group='Take Profit', inline='Take Profit 3')
// Take profit 4
// ░░░░░░░░░░░░░░░░░░░░░░░░░░░░░░░░░░░░░░░░░░░░░░░░░░░░░░░░░░░░░░░░░░░░░░░░░░░░░░░░░░░░░░░░░░░░░░░░░░░░░░░░░░░░░░░░░░░░░░░░░░░░░░░░░░░░░░░░░░░░░░░░░░
tp4 = input.float(title='Take Profit 4 - Target %', defval=100, minval=0.0, step=0.5, group='Take Profit')
/// Stop Loss
// ░░░░░░░░░░░░░░░░░░░░░░░░░░░░░░░░░░░░░░░░░░░░░░░░░░░░░░░░░░░░░░░░░░░░░░░░░░░░░░░░░░░░░░░░░░░░░░░░░░░░░░░░░░░░░░░░░░░░░░░░░░░░░░░░░░░░░░░░░░░░░░░░░░
stoplossPercent = input.float(title='Stop Loss (%)', defval=999, minval=0.01, group='Stop Loss') * 0.01
slLongClose = close < strategy.position_avg_price * (1 - stoplossPercent)
slShortClose = close > strategy.position_avg_price * (1 + stoplossPercent)
/// Leverage
// ░░░░░░░░░░░░░░░░░░░░░░░░░░░░░░░░░░░░░░░░░░░░░░░░░░░░░░░░░░░░░░░░░░░░░░░░░░░░░░░░░░░░░░░░░░░░░░░░░░░░░░░░░░░░░░░░░░░░░░░░░░░░░░░░░░░░░░░░░░░░░░░░░░
leverage = input.float(1, 'Leverage', step=.5, group='Leverage')
contracts = math.min(math.max(.000001, strategy.equity / close * leverage), 1000000000)
/// Trade State Management
// ░░░░░░░░░░░░░░░░░░░░░░░░░░░░░░░░░░░░░░░░░░░░░░░░░░░░░░░░░░░░░░░░░░░░░░░░░░░░░░░░░░░░░░░░░░░░░░░░░░░░░░░░░░░░░░░░░░░░░░░░░░░░░░░░░░░░░░░░░░░░░░░░░░
isInLongPosition = strategy.position_size > 0
isInShortPosition = strategy.position_size < 0
/// ProfitView Alert Syntax String Generation
// ░░░░░░░░░░░░░░░░░░░░░░░░░░░░░░░░░░░░░░░░░░░░░░░░░░░░░░░░░░░░░░░░░░░░░░░░░░░░░░░░░░░░░░░░░░░░░░░░░░░░░░░░░░░░░░░░░░░░░░░░░░░░░░░░░░░░░░░░░░░░░░░░░░
alertSyntaxPrefix = input.string(defval='CRYPTANEX_99FTX_Strategy-Name-Here', title='Alert Syntax Prefix', group='ProfitView Alert Syntax')
alertSyntaxBase = alertSyntaxPrefix + '\n#' + str.tostring(open) + ',' + str.tostring(high) + ',' + str.tostring(low) + ',' + str.tostring(close) + ',' + str.tostring(volume) + ','
/// Trade Execution
// ░░░░░░░░░░░░░░░░░░░░░░░░░░░░░░░░░░░░░░░░░░░░░░░░░░░░░░░░░░░░░░░░░░░░░░░░░░░░░░░░░░░░░░░░░░░░░░░░░░░░░░░░░░░░░░░░░░░░░░░░░░░░░░░░░░░░░░░░░░░░░░░░░░
longConditionCalc = (longCondition and isADXEnabledAndAboveThreshold)
shortConditionCalc = (shortCondition and isADXEnabledAndAboveThreshold)
if calcPeriod
if longConditionCalc and tradeDirection != 'Short Only' and isInLongPosition == false
strategy.entry('Long', strategy.long, qty=contracts)
alert(message=alertSyntaxBase + 'side:long', freq=alert.freq_once_per_bar_close)
if shortConditionCalc and tradeDirection != 'Long Only' and isInShortPosition == false
strategy.entry('Short', strategy.short, qty=contracts)
alert(message=alertSyntaxBase + 'side:short', freq=alert.freq_once_per_bar_close)
//Inspired from Multiple %% profit exits example by adolgo https://www.tradingview.com/script/kHhCik9f-Multiple-profit-exits-example/
strategy.exit('TP1', qty_percent=q1, profit=per(tp1))
strategy.exit('TP2', qty_percent=q2, profit=per(tp2))
strategy.exit('TP3', qty_percent=q3, profit=per(tp3))
strategy.exit('TP4', profit=per(tp4))
strategy.close('Long', qty_percent=100, comment='SL Long', when=slLongClose)
strategy.close('Short', qty_percent=100, comment='SL Short', when=slShortClose)
strategy.close_all(when=closeLongCondition or closeShortCondition, comment='Close Postion')
/// Dashboard
// ░░░░░░░░░░░░░░░░░░░░░░░░░░░░░░░░░░░░░░░░░░░░░░░░░░░░░░░░░░░░░░░░░░░░░░░░░░░░░░░░░░░░░░░░░░░░░░░░░░░░░░░░░░░░░░░░░░░░░░░░░░░░░░░░░░░░░░░░░░░░░░░░░░
// Inspired by https://www.tradingview.com/script/uWqKX6A2/ - Thanks VertMT