मासिक ट्रेंड ब्रेकआउट रणनीति

अवलोकन
मासिक रुझान तोड़ने की रणनीति पाइन स्क्रिप्ट पर आधारित एक ट्रेडिंग व्यू सूचक है। यह रणनीति अनुकूलित चलती औसत, रुझान रेखा तोड़ने और आरएसआई सूचकांक के संयोजन का उपयोग करती है, जो प्रति माह केवल एक बार मल्टीहेड प्रवेश का समय निर्धारित करती है। जब आरएसआई सूचक ओवरबॉट दिखाता है, तो स्थिति से बाहर निकल जाता है।
रणनीति सिद्धांत
-
lastEntryMonth को पिछले प्रवेश के महीने के रूप में परिभाषित करें. currentMonth को वर्तमान महीने के रूप में प्राप्त करें.
-
TRAMA को चलती औसत पैरामीटर length=99 के लिए समायोजित करें, कीमतों को चिकना करने और प्रवृत्ति की दिशा का आकलन करने के लिए।
-
parameter length_trend=14 सेट करें, उच्च बिंदु के लिए प्रवृत्ति रेखा upper. जब कीमत ऊपर की ओर प्रवृत्ति रेखा को पार करती है, तो इसे तोड़ने के रूप में माना जाता है.
-
आरएसआई संकेतक पैरामीटर rsiLength = 14 की गणना करें, ओवरबॉट और ओवरसोल्ड को निर्धारित करें।
-
प्रवेश तर्कः यदि पिछले महीने प्रवेश नहीं किया गया था, तो अधिक प्रवेश करें जब समापन मूल्य TRAMA से अधिक है और समापन मूल्य ट्रैक पर है।
-
बाहर निकलने का तर्कः जब आरएसआई 70 से अधिक हो, तो ब्लीचिंग।
-
TRAMA वक्र को रेखांकित करें, RSI की ओवरबॉय लाइन, रणनीति को पूरा करें।
यह रणनीति तीन मुख्यधारा के तकनीकी संकेतकों को एकीकृत करती है, जो प्रवृत्ति, गति और ओवरबॉय ओवरसेलिंग की स्थिति का आकलन करती है, और प्रति माह केवल एक बार कम जोखिम के लिए अधिक अवसरों की तलाश करती है। साथ ही, केवल कीमतों में वृद्धि की प्रवृत्ति को तोड़ने के लिए प्रतिबंध लगाता है, ताकि पूर्णांक के दौरान अप्रभावी संचालन से बचा जा सके।
श्रेष्ठता विश्लेषण
-
विभिन्न सूचकांकों का संयोजन, बाजार की स्थिति का समग्र आकलन, निर्णय लेने की सटीकता में सुधार।
-
केवल मासिक समय सीमा के माध्यम से प्रवेश करें और बार-बार व्यापार से बचें
-
एक अनुकूलनशील चलती औसत का उपयोग करके प्रवृत्ति की दिशा का आकलन करें और एक मोड़ को जल्दी से पकड़ें।
-
ओवरबॉय इंडिकेटर के साथ बाजार के उच्च स्तर से बचें और जोखिम को प्रभावी ढंग से नियंत्रित करें।
-
एक सरल, सहज ज्ञान युक्त प्रवेश और बाहर निकलने की शर्तें।
-
बेहतर रणनीति अनुकूलन के लिए अपनी आवश्यकता के अनुसार पैरामीटर को समायोजित कर सकते हैं।
जोखिम विश्लेषण
-
एक बार प्रवेश करने के बाद, कीमत फिर से पटरी पर आ जाती है, जिससे नुकसान हो सकता है।
-
ट्रेंड ब्रेकआउट के समय खराब चयन, शीर्ष के पास उच्च प्रविष्टि का चयन करना।
-
गलत तरीके से सेट किए गए संकेतक पैरामीटर के कारण संकेतक में गलत संकेत मिलते हैं।
-
ब्रेक केवल Reflect recent market volatility. Consider adaptive stops/position sizing. हाल ही में बाजार में उतार-चढ़ाव को दर्शाते हैं।
-
Monitor risk/reward. Consider only trading pullbacks or adding other confirmation filters.
-
Validate indicators on multiple timeframes. Use higher timeframes to identify trend and lower for entry.
-
Backtest over different market conditions. Optimize parameters to match strategy to market type.
अनुकूलन दिशा
-
वॉल्यूम, एमए लेनदेन की पुष्टि करें, कम मात्रा में झूठे ब्रेकडाउन से बचें।
-
आरएसआई ने अपनी स्थिति को बंद करने के लिए कुछ लाभ के लिए स्टॉपलॉस को ध्यान में रखा।
-
चलती औसत पैरामीटर का अनुकूलन, परिवर्तन के लिए अनुकूलन, बेहतर ट्रेंड रूपांतरण ट्रैक करना।
-
ब्रेक पॉइंट से पहले और बाद में एक अंतर स्थापित करें, सीधे मोड़ बिंदु पर उच्च प्रवेश से बचें।
-
निर्णय की सटीकता में सुधार के लिए अधिक फ़िल्टरिंग मानदंडों जैसे कि चैनल सूचकांक, उतार-चढ़ाव सूचकांक आदि को जोड़ना।
-
यदि कीमतें नए प्रतिरोध रेखा को तोड़ने के लिए जारी रहती हैं, तो वे जमा कर सकते हैं।
संक्षेप
मासिक प्रवृत्ति तोड़ने की रणनीति में प्रवृत्ति, ऊर्जा और सीमा की स्थिति जैसे कई कारक शामिल हैं। यह प्रवृत्ति की दिशा का आकलन करने के लिए मासिक समय के फ्रेम में है, और कम समय के फ्रेम में प्रवेश करने के लिए ब्रेक-इन निष्पादन को जोड़ता है। साथ ही, आरएसआई का उपयोग करके ट्रेडिंग जोखिम को प्रभावी ढंग से नियंत्रित किया जाता है। यह रणनीति एक महीने में एक बार बेहतर अवसर खोजने के लिए सरल तर्क के साथ काम करती है। यह प्रवृत्ति ट्रैकिंग पर विचार करती है और जोखिम प्रबंधन पर जोर देती है।
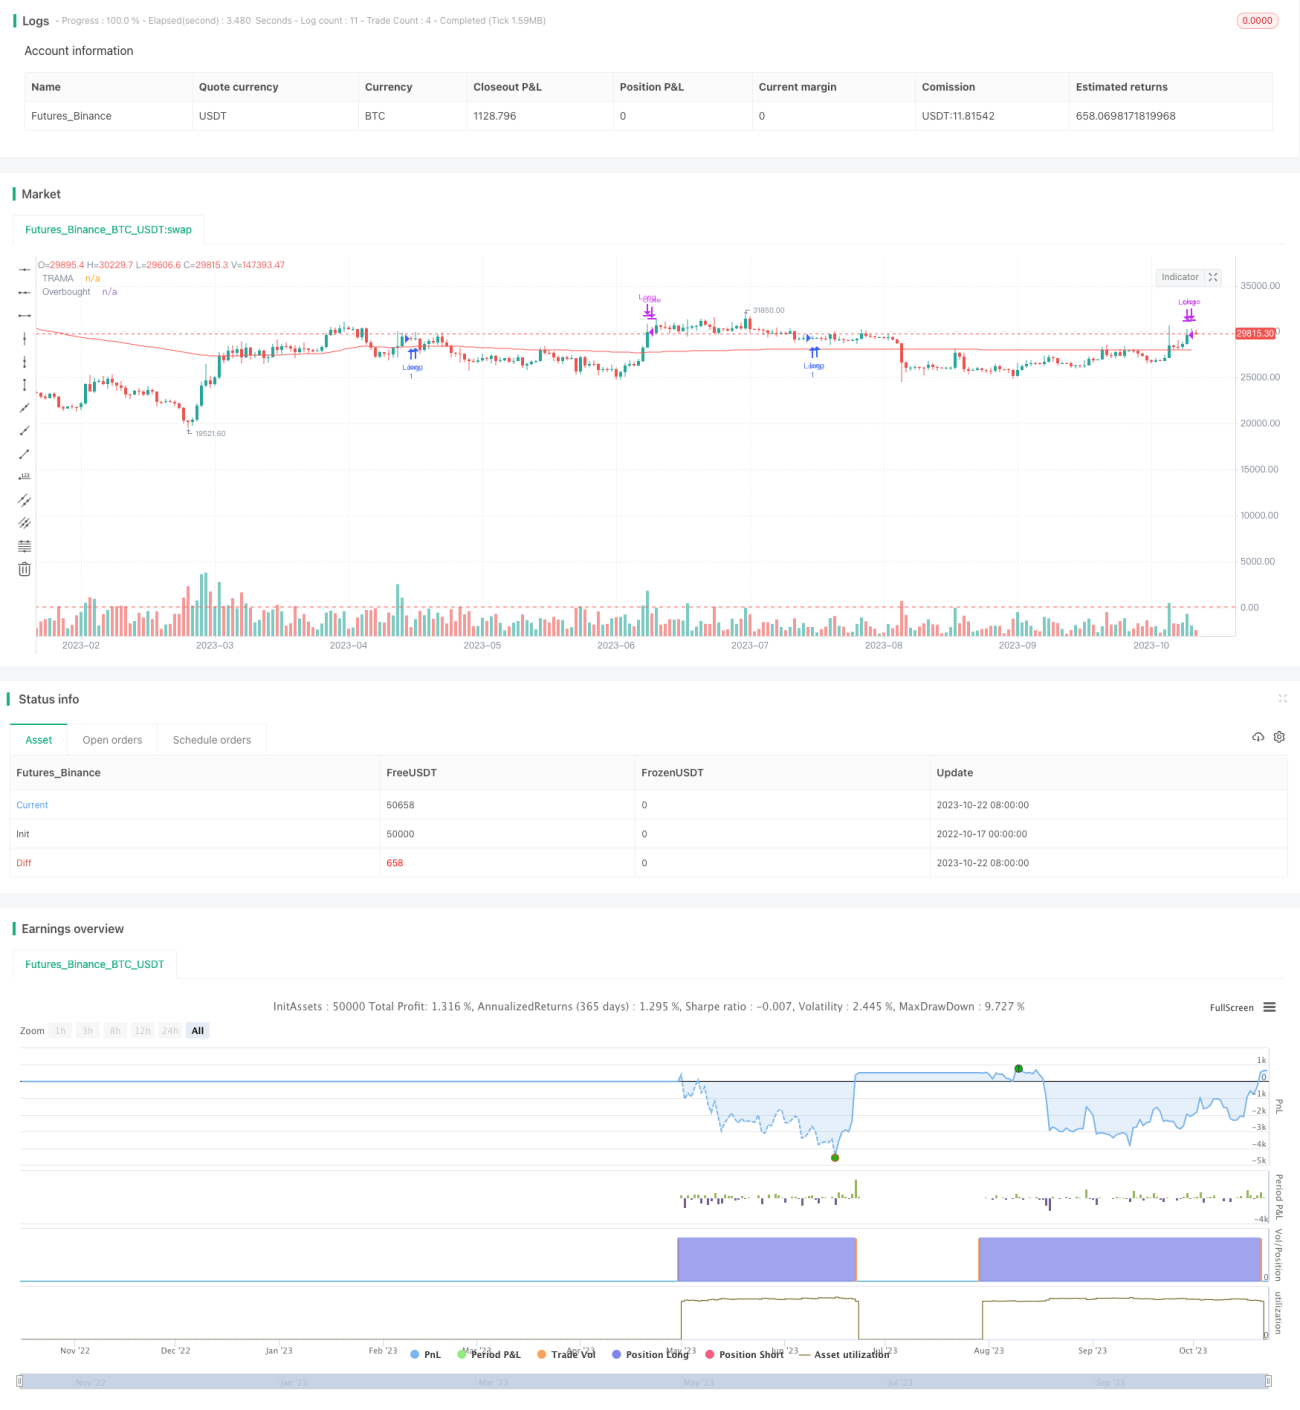
/*backtest
start: 2022-10-17 00:00:00
end: 2023-10-23 00:00:00
period: 1d
basePeriod: 1h
exchanges: [{"eid":"Futures_Binance","currency":"BTC_USDT"}]
*/

//@version=5
strategy('Bannos Strategy', shorttitle='Bannos', overlay=true)

//The provided script is an indicator for TradingView written in Pine Script version 5. The indicator is used to determine entry and exit points for a trading strategy. Here's a detailed breakdown of what the script does:- 1