स्टोकेस्टिक आरएसआई और ईएमए पर आधारित स्वायत्त खरीद-स्विंग स्केलपर रणनीति

अवलोकन
इस रणनीति का उद्देश्य सिक्कों को खरीदने और रखने के लिए एक स्केलर ट्रेडिंग रणनीति है, जो कि यादृच्छिक सूचकांक चिकनी चलती औसत (आरएसआई) और सूचकांक चलती औसत (ईएमए) पर आधारित है। यह 5 मिनट के लाइन पर लागू होता है और बीटीसी के लिए अनुकूलित किया गया है। रणनीति का लक्ष्य है कि जितना संभव हो उतना सिक्का रखें जब यह पार हो जाए या बहुत कम हो जाए।
रणनीति सिद्धांत
यह रणनीति आरएसआई सूचक का उपयोग करती है ताकि यह पता लगाया जा सके कि क्या यह ओवरबॉट ओवरसोल्ड क्षेत्र में है और इसे खरीदने और बेचने के संकेतों के लिए यादृच्छिक आरएसआई सूचक के के- और डी-वैल्यू संबंधों के साथ जोड़ा गया है।
जब यादृच्छिक आरएसआई के के लाइन 20 से नीचे होता है, तो इसे ओवरसोल्ड माना जाता है, और जब के लाइन डी लाइन से अधिक होती है, तो एक खरीद संकेत उत्पन्न होता है। इसके बाद, यह तीन शर्तों के आधार पर तय किया जाता है कि क्या बेचा गया हैः 1) ईएमए पलटाव 1 प्रतिशत से अधिक की कीमत में वृद्धि के बाद होता है; 2) जब यादृच्छिक आरएसआई के के लाइन डी लाइन से नीचे होती है; 3) जब स्टॉप-लॉस मूल्य प्रवेश मूल्य का 98.5% तक पहुंचता है।
इसके अलावा, जब अल्पकालिक ईएमए में गिरावट होती है, तो इसे बेचने के संकेत के रूप में माना जाता है।
रणनीतिक लाभ
- यादृच्छिक आरएसआई का उपयोग करना खरीद के समय को अधिक विश्वसनीय बनाता है, और नकली ब्रेकआउट को प्रभावी ढंग से फ़िल्टर कर सकता है।
- ईएमए सूचकांक के साथ संयोजन में, यह बेहतर ढंग से पता लगाया जा सकता है कि रुझान कब बदल रहा है।
- स्टॉप लॉस को प्रभावी ढंग से नियंत्रित किया जा सकता है।
- जितना संभव हो उतना सिक्का रखने से लेनदेन की आवृत्ति कम हो जाती है और प्रसंस्करण शुल्क कम हो जाता है।
रणनीतिक जोखिम
- आरएसआई संकेतक के झूठे संकेत देने की संभावना। आरएसआई पैरामीटर को अनुकूलित करने के लिए उचित रूप से समायोजित किया जा सकता है।
- स्टॉप प्राइस को बहुत कम सेट करने से नुकसान बढ़ सकता है। स्टॉप की सीमा को उचित रूप से समायोजित किया जा सकता है।
- ईएमए सूचकांक पैरामीटर को गलत तरीके से सेट करना प्रवृत्ति को बदलने का समय चूक सकता है। विभिन्न ईएमए चक्रों के लिए पैरामीटर का परीक्षण किया जा सकता है।
अनुकूलन दिशा
- विभिन्न आरएसआई और यादृच्छिक आरएसआई पैरामीटर सेटिंग्स का परीक्षण करने के लिए ऑप्टिमाइज़ेशन को खोजने के लिए
- विभिन्न स्टॉप लॉस को संतुलित करने के लिए प्रयास करें ताकि नुकसान से बचा जा सके और मुनाफा वापस ले सके
- प्रवृत्ति में परिवर्तन के लिए सबसे अच्छा पैरामीटर निर्धारित करने के लिए ईएमए के दीर्घकालिक और अल्पकालिक संयोजन का परीक्षण करें
- अन्य संकेतकों को शामिल करने पर विचार किया जा सकता है ताकि खरीद-बिक्री समय निर्धारण की सटीकता में सुधार किया जा सके
संक्षेप
रणनीति यादृच्छिक आरएसआई और ईएमए जैसे कई संकेतकों के लाभ को एकीकृत करती है, और खरीदने और बेचने के समय का आकलन करने के लिए एक अधिक मजबूत दृष्टिकोण का उपयोग करती है। पैरामीटर अनुकूलन और जोखिम प्रबंधन के माध्यम से रणनीति की रिटर्न दर और स्थिरता को और बढ़ाया जा सकता है। कुल मिलाकर, रणनीति तर्कसंगत है और यह परीक्षण और अनुकूलन के लायक है।
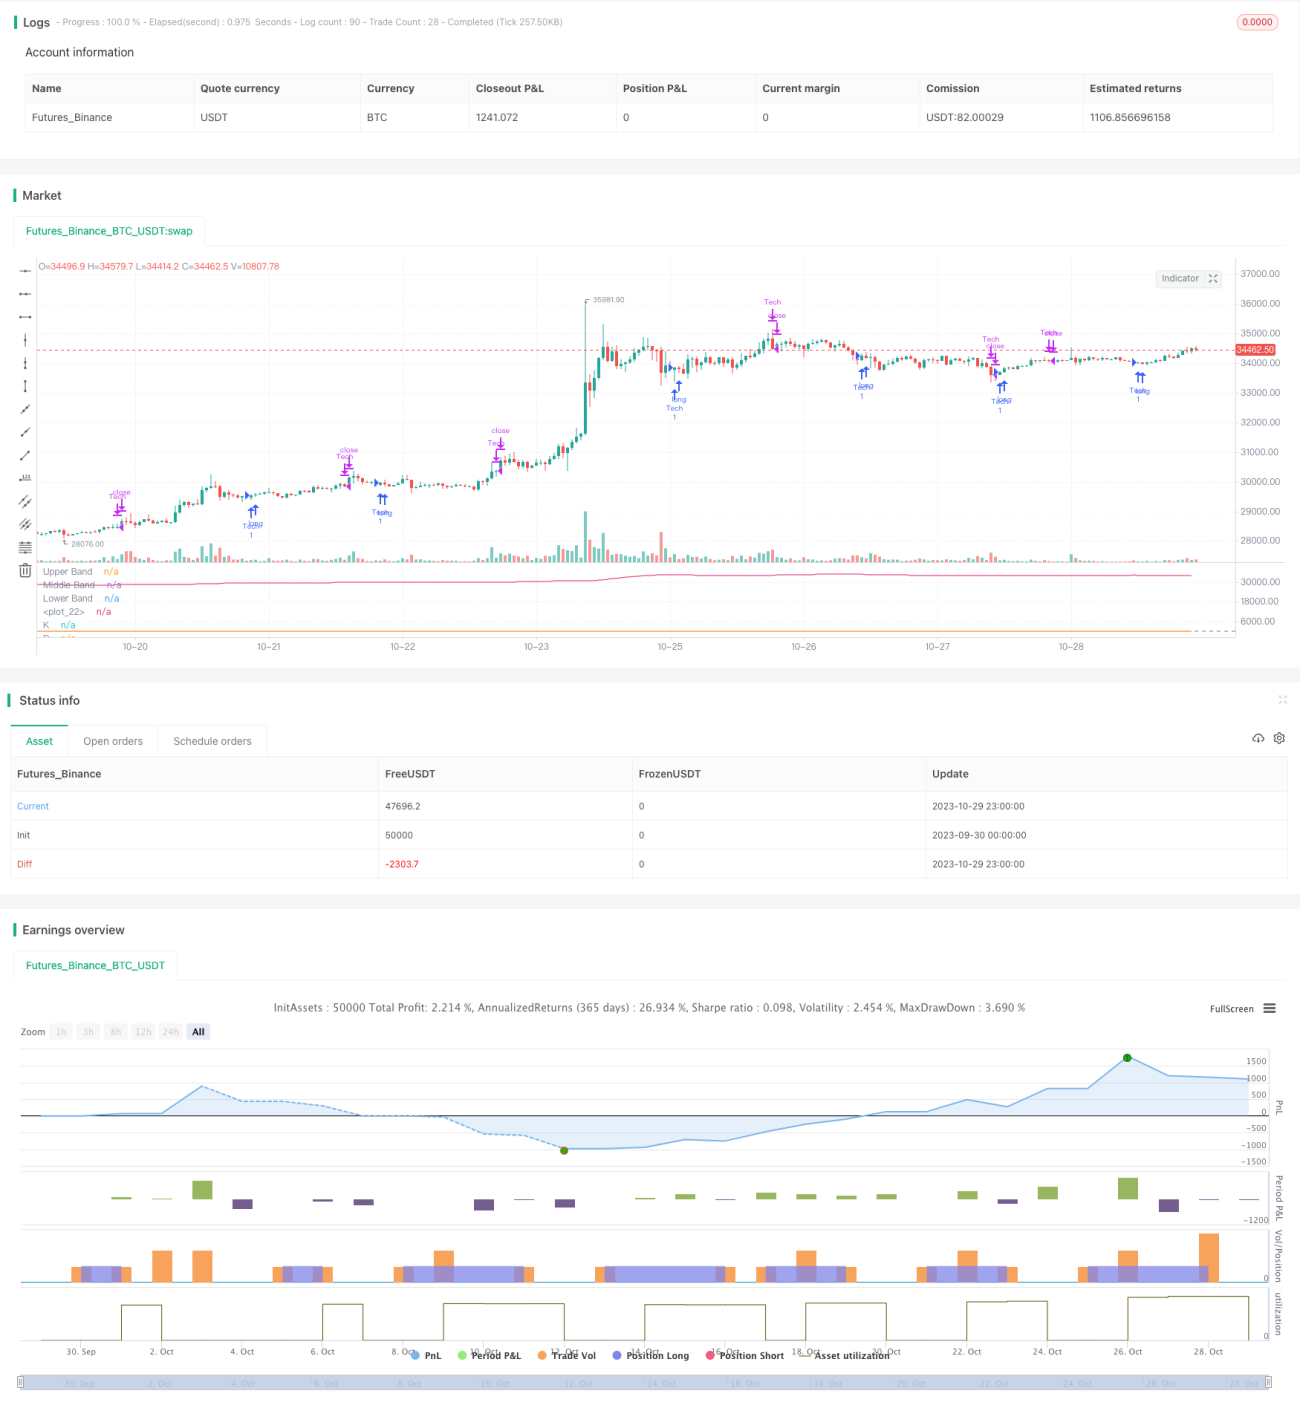
/*backtest
start: 2023-09-30 00:00:00
end: 2023-10-30 00:00:00
period: 1h
basePeriod: 15m
exchanges: [{"eid":"Futures_Binance","currency":"BTC_USDT"}]
*/

//@version=5
strategy(title="Stochastic RSI W Auto Buy Scalper Scirpt III ", shorttitle="Stoch RSI_III", format=format.price, precision=2)
smoothK = input.int(3, "K", minval=1)
smoothD = input.int(3, "D", minval=1)- 1