बोलिंगर बैंड-आधारित प्रवृत्ति उत्क्रमण रणनीति

अवलोकन
यह रणनीति ब्रोकर बैंड सूचकांक और चलती औसत पर आधारित है, यह निर्धारित करने के लिए कि क्या कीमत ब्रोकर बैंड के करीब है या नहीं, जब यह ब्रोकर बैंड के नीचे है, तो यह लंबी या छोटी पोजीशन लेती है, जिससे लाभ होता है। जब कीमत ब्रोकर बैंड के नीचे है, तो यह कम है; जब कीमत ब्रोकर बैंड के नीचे है, तो यह अधिक है। यह दो व्यापारिक रणनीतियों के लाभों को जोड़ती है।
सिद्धांत
यह रणनीति मुख्य रूप से निम्नलिखित दो प्रवेश संकेतों का आकलन करती हैः
-
मल्टीहेड सिग्नलः जब क्लोजर प्राइस डाउन ट्रैक को छूता है और क्लोजर प्राइस ईएमए औसत से ऊपर होता है, तो पूर्व के-लाइन एंटिटी के लिए नकारात्मक और वर्तमान के-लाइन एंटिटी के लिए सकारात्मक होता है।
-
खाली सिर सिग्नल: जब समापन मूल्य ऊपर की ओर जाता है और समापन मूल्य ईएमए औसत रेखा से नीचे होता है, तो पूर्व के-लाइन इकाई को पॉवर लाइन माना जाता है और वर्तमान के-लाइन इकाई को पॉवर लाइन माना जाता है।
स्टॉप लॉस विधिः फिक्स्ड स्टॉप लॉस. स्टॉप लॉस बिंदु प्रवेश मूल्य के लिए प्रतिद्वंद्वी की पटरी की दूरी के कई गुना जोखिम रिटर्न गुणांक है.
स्टॉप स्टॉप विधिः लक्ष्य लाभ प्रतिद्वंद्वी के लिए है। यानी, अधिक स्टॉप स्टॉप के लिए नीचे रैक, खाली स्टॉप स्टॉप के लिए ऊपर रैक।
लाभ
-
प्रवृत्ति और प्रतिवर्तन रणनीति के संयोजन के लाभों के साथ, यह प्रवृत्ति में उतार-चढ़ाव के दौरान बेहतर प्रदर्शन करता है।
-
ब्रींग बैंड सूचकांक का उपयोग करके ओवरबॉट और ओवरसोल्ड क्षेत्रों का पता लगाने के लिए, रिवर्स अवसरों का सटीक आकलन करें।
-
स्थिर स्टॉपलॉस को तर्कसंगत रूप से निर्धारित किया गया है, जो जोखिम नियंत्रण में मदद करता है।
-
मोबाइल स्टॉप के माध्यम से लाभ को अधिकतम करें।
जोखिम
-
तोडफोड़ रणनीतियों को तर्कसंगत बनाया जा सकता है, इसलिए नकली तोडफोड़ से सावधान रहें।
-
जब स्थिति बहुत अधिक हिलाती है, तो स्टॉप लॉस को अक्सर ट्रिगर किया जा सकता है।
-
फिक्स्ड स्टॉप लॉस को बाजार में उतार-चढ़ाव के आधार पर समायोजित नहीं किया जा सकता है और यह बहुत उदार या बहुत कट्टरपंथी हो सकता है।
-
यदि आप ब्रिन बैंड पैरामीटर को गलत तरीके से सेट करते हैं, तो परिणाम खराब हो सकते हैं।
सोच को अनुकूलित करें
-
आरएसआई संकेतकों के संयोजन पर विचार किया जा सकता है, जैसे कि आरएसआई 50 से अधिक है, फिर से करें, आरएसआई 50 से कम है, फिर से खाली करें, ताकि गलत संकेतों से बचा जा सके।
-
स्थिर रोक दूरी को स्वचालित रूप से समायोजित करने के लिए एक अतिरिक्त सुविधा जो रोक को अधिक लचीला बनाती है। उदाहरण के लिए, एटीआर सूचकांक के अनुसार गतिशील रूप से रोक दूरी सेट करें।
-
ब्रिन बैंड पैरामीटर को अनुकूलित करें, सबसे अच्छा पैरामीटर संयोजन ढूंढें
-
विभिन्न ईएमए औसत रेखा मापदंडों का परीक्षण किया जा सकता है, औसत रेखा के तटबंध प्रभाव को अनुकूलित करने के लिए।
संक्षेप
यह रणनीति व्यापक रूप से प्रवृत्ति और प्रतिगमन को ध्यान में रखती है, बुरिन बैंड का उपयोग करके ओवरबॉय ओवरसेल पॉइंट प्रवेश का निर्धारण करती है, और मोबाइल स्टॉप के माध्यम से मुनाफे को अधिकतम करती है। प्रवृत्ति में उतार-चढ़ाव की स्थिति में बेहतर प्रदर्शन करता है। हालांकि, इस घटना को रोकने के लिए सावधानी बरतने की आवश्यकता है, जबकि पैरामीटर को अनुकूलित करने के लिए रणनीति की प्रभावशीलता को समायोजित करने की आवश्यकता है। कुल मिलाकर, यह एक अधिक व्यावहारिक और कुशल रणनीति है।
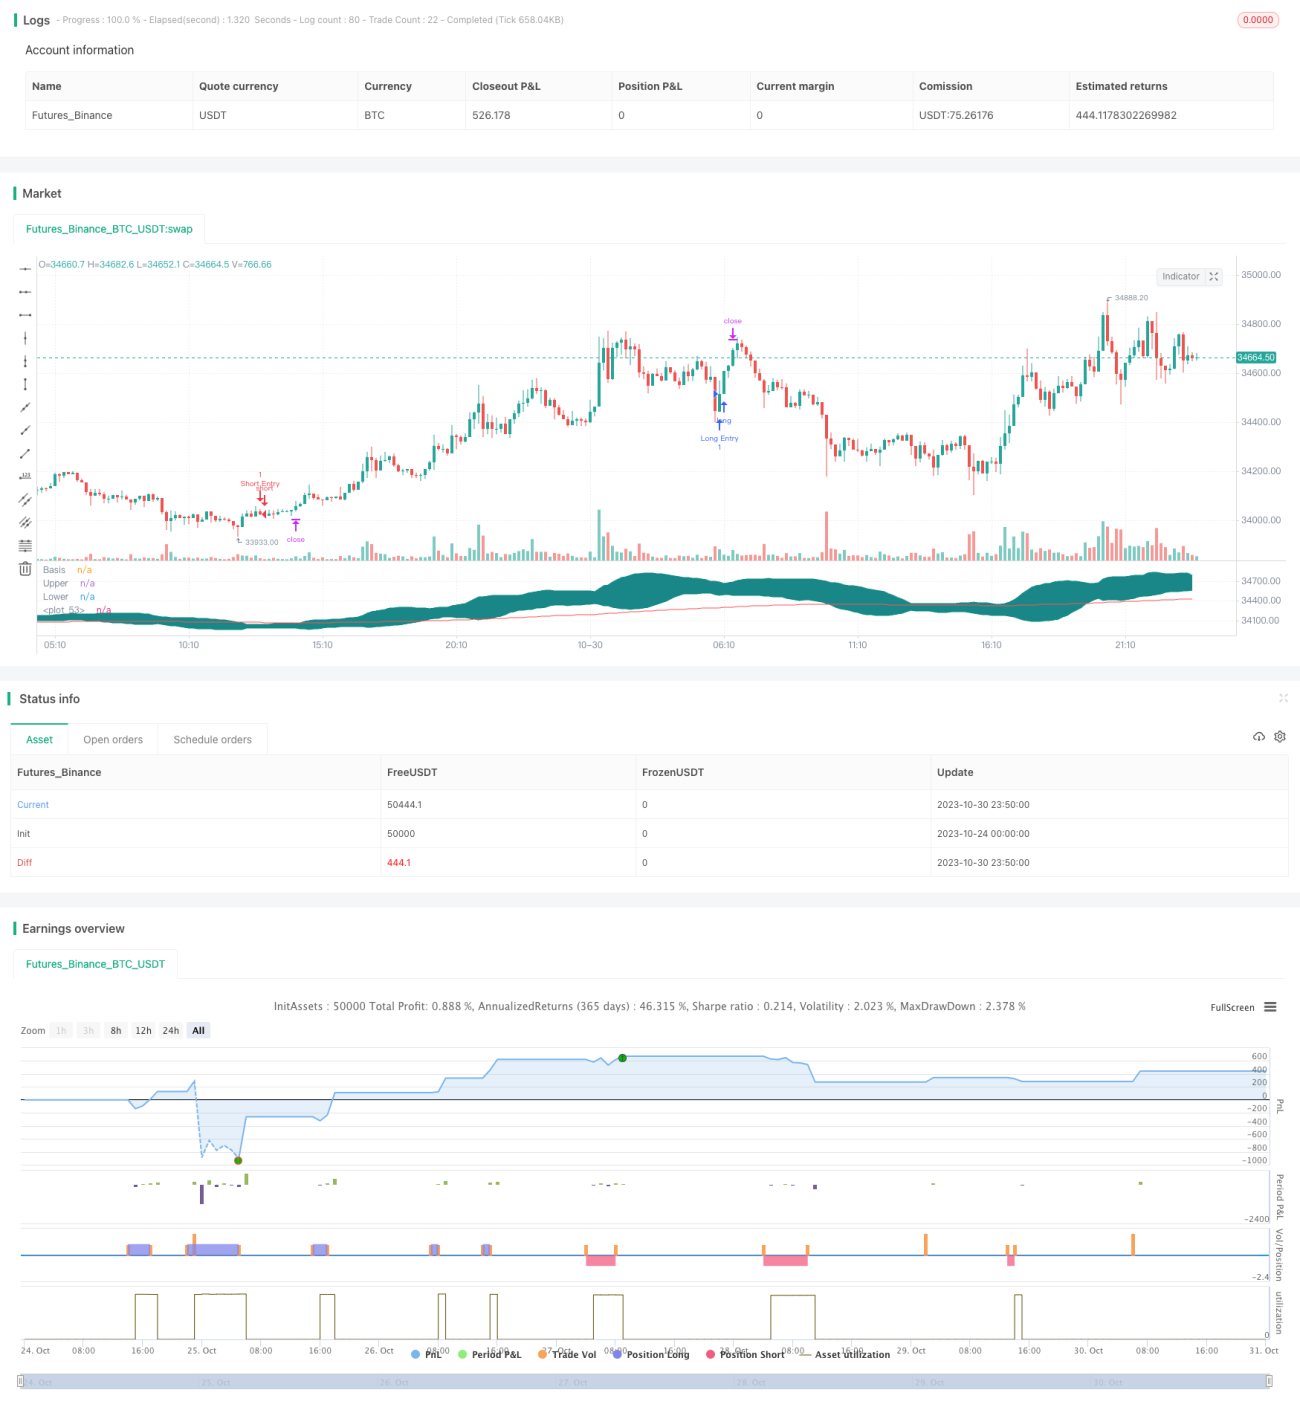
/*backtest
start: 2023-10-24 00:00:00
end: 2023-10-31 00:00:00
period: 10m
basePeriod: 1m
exchanges: [{"eid":"Futures_Binance","currency":"BTC_USDT"}]
*/

//@version=4

// Welcome to yet another script. This script was a lot easier since I was stuck for so long on the Donchian Channels one and learned so much from that one that I could use in this one
// This code should be a lot cleaner compared to the Donchian Channels, but we'll leave that up to the pro's- 1