गति अनुसरण के साथ शैफ़ ट्रेंड साइकिल रणनीति

अवलोकन
यह रणनीति Schaff प्रवृत्ति चक्र सूचक पर आधारित है, जो Stoch RSI के ओवरबॉय ओवरसोल सिद्धांत के साथ संयुक्त है, जो गतिशीलता सूचक के माध्यम से प्रवृत्ति का निर्णय और पालन करने में सक्षम है। जब कीमत ओवरबॉय क्षेत्र से ओवरबॉय क्षेत्र में प्रवेश करती है, तो अधिक करें; जब कीमत ओवरबॉय क्षेत्र से ओवरबॉय क्षेत्र में प्रवेश करती है, तो खाली करें। यह रणनीति मूल्य प्रवृत्ति के परिवर्तन बिंदुओं को पकड़कर, गतिशील रूप से स्थिति को समायोजित करती है, और मूल्य आंदोलन को ट्रैक करती है।
रणनीति सिद्धांत
-
- MACD की गणना करें, जिसमें Fast Length का डिफ़ॉल्ट मान 23 है, Slow Length का डिफ़ॉल्ट मान 50 है। MACD अल्पकालिक और दीर्घकालिक चलती औसत के अंतर को दर्शाता है, जिसका उपयोग मूल्य आंदोलन को निर्धारित करने के लिए किया जाता है।
-
- MACD को Stoch RSI के साथ संसाधित किया जाता है, जिससे K का मूल्य प्राप्त होता है, जिसमें Cycle Length का डिफ़ॉल्ट मान 10 होता है, जो MACD के गतिशील संकेतक को प्रतिबिंबित करता है।
-
- K मान के लिए भारित चलती औसत, D मान का गठन, जिसमें 1st %D Length डिफ़ॉल्ट 3 है, K मान में शोर को हटा दिया गया है।
-
- स्टोच आरएसआई को डी मान पर फिर से संसाधित किया जाता है, जिससे प्रारंभिक एसटीसी मान बनता है, जिसमें 2nd % डी लेंथ का डिफ़ॉल्ट मान 3 होता है, जिससे एक सटीक ओवरबॉट और ओवरसोल सिग्नल बनता है।
-
- प्रारंभिक एसटीसी मूल्य के लिए एक भारित चलती औसत, अंतिम एसटीसी मूल्य प्राप्त करें, जो 0-100 की सीमा में है। एसटीसी 75 से अधिक ओवरबॉय क्षेत्र है, 25 से कम ओवरबॉय क्षेत्र है।
-
- जब एसटीसी नीचे से ऊपर की ओर 25 के पार हो, तो अधिक करें; जब एसटीसी ऊपर से नीचे की ओर 75 के पार हो, तो खाली करें।
रणनीतिक लाभ
-
- एसटीसी सूचक स्टोच आरएसआई के डिजाइन के साथ संयोजन में है, जो एक मजबूत प्रवृत्ति संकेत बनाने के लिए ओवरबॉय और ओवरसोल्ड क्षेत्रों की स्पष्ट पहचान करता है।
-
- दोहरे स्टोच आरएसआई फ़िल्टर के माध्यम से, एक झूठी दरार को प्रभावी रूप से फ़िल्टर किया जा सकता है।
-
- STC 0-100 मानकीकृत सीमा बनाता है, जो यांत्रिक व्यापार संकेतों के गठन की सुविधा प्रदान करता है।
-
- इस रणनीति में दृश्यता के साथ ब्रेक मार्कर और टेक्स्ट पॉप-अप अलार्म शामिल हैं, जो स्पष्ट रूप से और सहजता से व्यापारिक अवसरों को पकड़ते हैं।
-
- इस रणनीति में एक अनुकूलित पैरामीटर संयोजन है जो अतिसंवेदनशील लेनदेन से बचने के लिए व्यर्थ लेनदेन को प्रभावी ढंग से नियंत्रित करता है।
रणनीतिक जोखिम
-
- एसटीसी सूचकांक पैरामीटर के प्रति संवेदनशील है, विभिन्न मुद्राओं और समय अवधि के लिए पैरामीटर के संयोजन को बाजार की विशेषताओं के अनुकूल करने की आवश्यकता होती है।
-
- ब्रेकआउट ट्रेडिंग रणनीतियों को आसानी से धोखा दिया जा सकता है और जोखिम को नियंत्रित करने के लिए स्टॉप लॉस की आवश्यकता होती है।
-
- कम तरलता वाले बाजारों में झूठी सफलताएं गलत संकेतों को ट्रिगर कर सकती हैं, जिन्हें संश्लेषित यातायात जैसे संकेतकों के साथ फ़िल्टर करने की आवश्यकता होती है।
-
- यह रणनीति केवल एसटीसी सूचकांक पर आधारित है, जो अन्य कारकों के साथ संयोजन में प्रवृत्ति की पुष्टि करने के लिए और रिवर्स स्टॉप को रोकने के लिए है।
-
- इस क्षेत्र में गलत संकेतों से बचने के लिए महत्वपूर्ण समर्थन प्रतिरोध पर ध्यान दें।
रणनीति अनुकूलन दिशा
-
- विभिन्न चक्रों और मुद्राओं के लिए MACD के पैरामीटर संयोजन को अनुकूलित करें
-
- स्टोच आरएसआई के के-मूल्य और डी-मूल्य पैरामीटर को अनुकूलित करें, और एसटीसी वक्र को चिकना करें।
-
- कम तरलता वाले बाजारों में झूठी सफलताओं से बचने के लिए संचयी लेनदेन सूचकांक।
-
- अन्य सूचकांकों को जोड़ें और प्रवृत्ति संकेतों को सत्यापित करें, जैसे कि ब्रिन बैंड।
-
- अतिरिक्त रोकथाम, जैसे कि मोबाइल रोकथाम या एटीआर रोकथाम
-
- प्रवृत्ति की पुष्टि सुनिश्चित करने के लिए प्रवेश की स्थिति को समायोजित करें, जैसे कि एक ब्रेक के बाद प्रवेश को वापस करना।
संक्षेप
Schaff प्रवृत्ति चक्र रणनीति गतिशीलता के संकेतकों के माध्यम से ओवरबॉय ओवरसोल क्षेत्र का निर्धारण करती है और कीमतों में अल्पकालिक प्रवृत्ति में बदलाव का आकलन करती है। यह रणनीति सरल है और विभिन्न बाजारों के मापदंडों के आधार पर समायोजित की जा सकती है, लेकिन इसमें जोखिम भी शामिल है। सहायक संकेतकों के माध्यम से निर्णय लेने और रोकने के लिए अनुकूलित किया जा सकता है, जो मजबूत प्रवृत्ति में बेहतर प्रभाव डालता है।
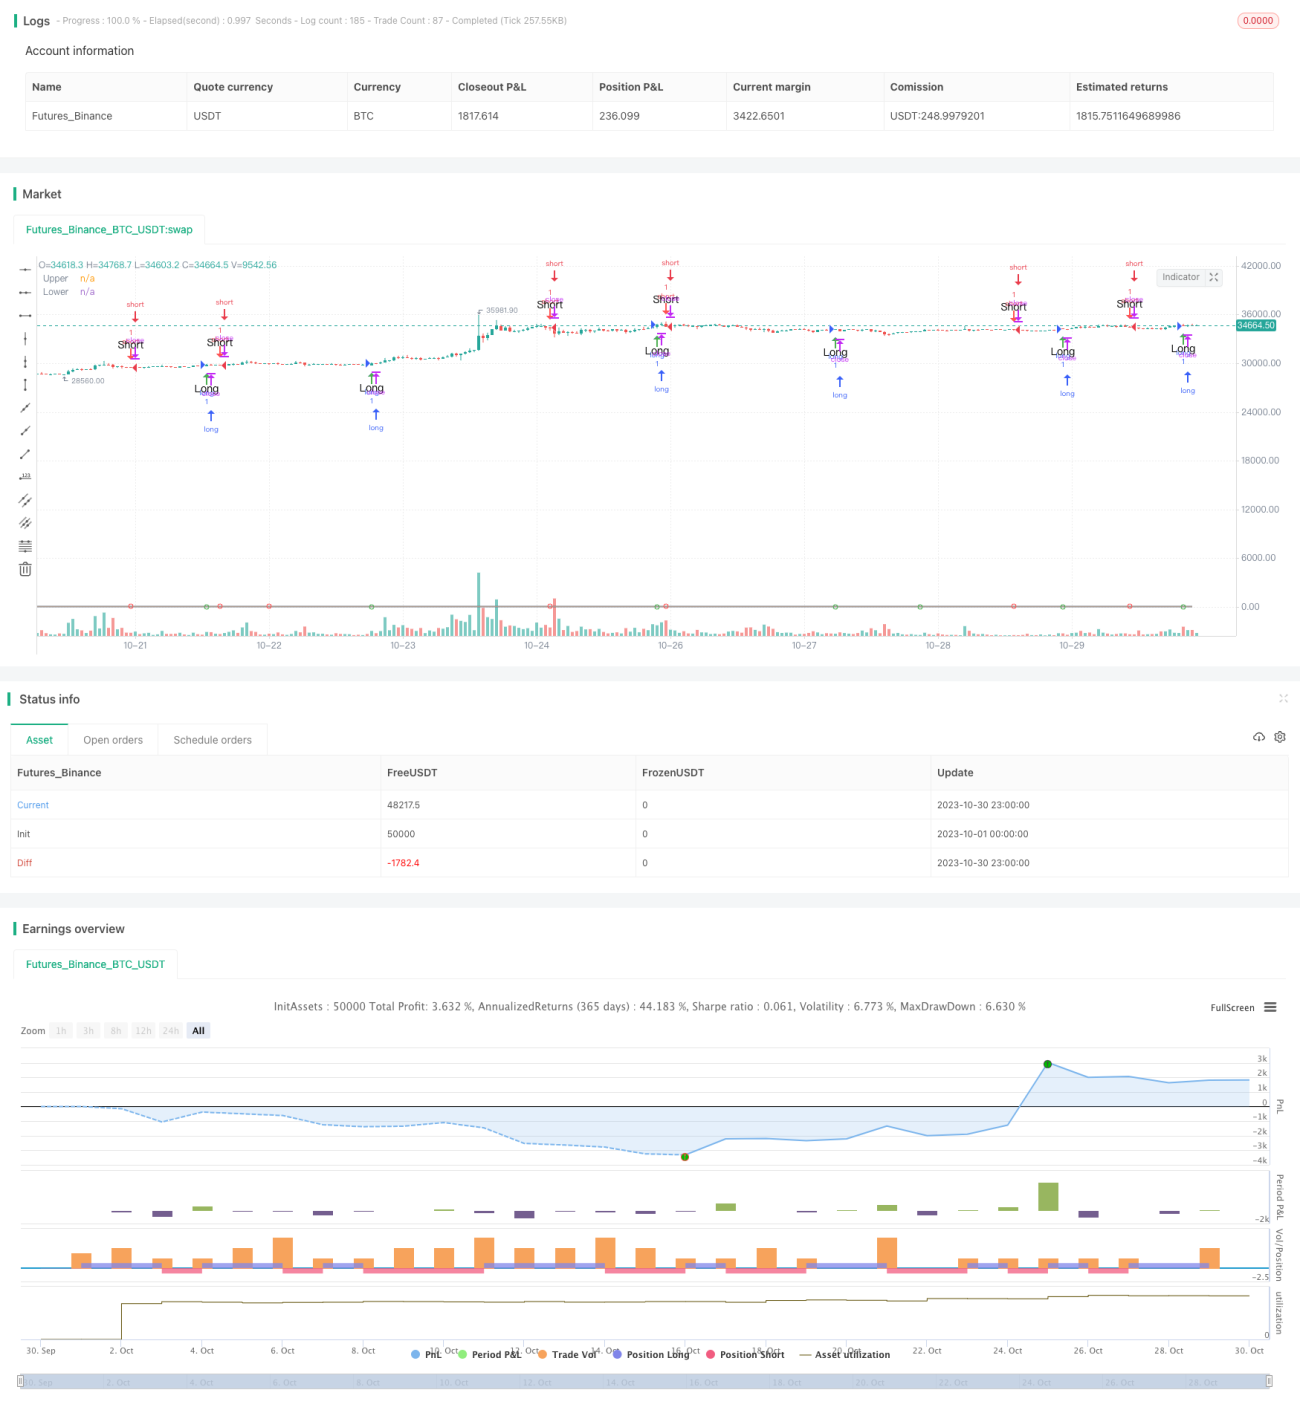
/*backtest
start: 2023-10-01 00:00:00
end: 2023-10-31 00:00:00
period: 1h
basePeriod: 15m
exchanges: [{"eid":"Futures_Binance","currency":"BTC_USDT"}]
*/

//@version=3
// Copyright (c) 2018-present, Alex Orekhov (everget)
// Schaff Trend Cycle script may be freely distributed under the MIT license.
strategy("Schaff Trend Cycle", shorttitle="STC Backtest", overlay=true)- 1