डबल मूविंग एवरेज क्रॉसओवर रिवर्सल रणनीति

1
Follow
1779
Followers
अवलोकन
इस रणनीति का मुख्य विचार तेजी से चलती औसत रेखा और धीमी गति से चलती औसत रेखा के क्रॉसिंग का उपयोग करके बाजार के रुझानों का आकलन करना है और शॉर्ट और लॉन्ग लाइन औसत रेखा के पलटाव के दौरान प्रवेश करना है, जिससे ट्रेंड ट्रैकिंग का प्रभाव प्राप्त होता है।
रणनीति सिद्धांत
- तेजी से चलती औसत अवधि shortma (डिफ़ॉल्ट 7 दिन) और धीमी गति से चलती औसत अवधि longma (डिफ़ॉल्ट 77 दिन) सेट करें
- जब एक छोटी रेखा औसत रेखा पर लंबी रेखा से गुजरती है तो इसे एक खरीद संकेत के रूप में दर्ज किया जाता है, barssince ((mabuy), लंबी रेखा का अर्थ है प्रवृत्ति में प्रवेश; जब एक छोटी रेखा औसत रेखा के नीचे लंबी रेखा से गुजरती है तो इसे एक बिक्री संकेत के रूप में दर्ज किया जाता है, barssince ((masell), लंबी रेखा का अर्थ है प्रवृत्ति का अंत
- बार्सिन की तुलना करें आकार, एक छोटी सी औसत रेखा जो ऊपर से नीचे की ओर पार करती है, बार्स की संख्या में वृद्धि से संकेत मिलता है कि प्रवृत्ति लंबे समय तक चलती है; इसके विपरीत, एक छोटी सी औसत रेखा जो नीचे से ऊपर की ओर पार करती है, बार्स की संख्या में वृद्धि से संकेत मिलता है कि रिवर्स सिग्नल मजबूत है
- खरीद संकेतों के बार की संख्या से अधिक बिकने वाले संकेतों के बार की संख्या से अधिक बिकने वाले संकेतों के बार की संख्या से अधिक बिकने वाले संकेतों के बार की संख्या से अधिक बिकने वाले संकेतों के बार की संख्या से अधिक बिकने वाले संकेतों की संख्या से अधिक बिकने वाले संकेत
- such रणनीति मूल रूप से एक द्वि-मध्यम-रेखा प्रतिगमन रणनीति है, जो तेजी से और धीमी गति से औसत-रेखा प्रतिगमन के माध्यम से रुझान टर्नओवर का आकलन करती है
रणनीतिक लाभ
- द्वि-समानता निर्णय का उपयोग करते हुए, कुछ शोर व्यापार संकेतों को फ़िल्टर किया गया
- बारसेंस तुलना को बढ़ाया गया, झूठे ब्रेक और क्लोज मूल्य रिवर्स के कारण गलत सिग्नल से बचा गया
- समझने और करने में आसान
- विभिन्न चक्रों और बाजारों के लिए अनुकूलन योग्य चलती औसत पैरामीटर
रणनीतिक जोखिम
- द्वि-समान-रेखा रणनीतियाँ अधिक संकेत उत्पन्न करती हैं और अधिक बार व्यापार करती हैं
- गलत तरीके से चलती औसत पैरामीटर सेट करने से लंबी प्रवृत्ति के अवसरों को याद किया जा सकता है
- लंबे समय तक औसत रेखा को तोड़ने पर, स्टॉप पॉइंट बहुत दूर हो सकता है और एक बड़ी वापसी हो सकती है
- स्पिरिल्ड और बाजार के झटके को प्रभावी ढंग से फ़िल्टर करने में असमर्थ
रणनीति अनुकूलन दिशा
- अन्य सूचकांकों पर फ़िल्टर जोड़ें ताकि आप आघात में फंसने से बच सकें
- अतिरिक्त रोकथाम
- चलती औसत रेखा मापदंडों के संयोजन का अनुकूलन करें
- बाजार चक्र गतिशीलता के आधार पर चलती औसत पैरामीटर
संक्षेप
रणनीति के लिए समग्र तर्क स्पष्ट और समझने में आसान है, तेजी से औसत रेखा और धीमी औसत रेखा उलट के माध्यम से बाजार की प्रवृत्ति टर्नओवर का न्याय करने के लिए, सिद्धांत रूप में प्रभावी रूप से ट्रेंड का पालन करने में सक्षम है। लेकिन वास्तविक उपयोग में अभी भी रणनीति एल्गोरिदम के लिए अनुकूलन की आवश्यकता है और पैरामीटर सेटिंग्स को अधिक स्थिर और व्यावहारिक बनाने के लिए।
Source
Pine
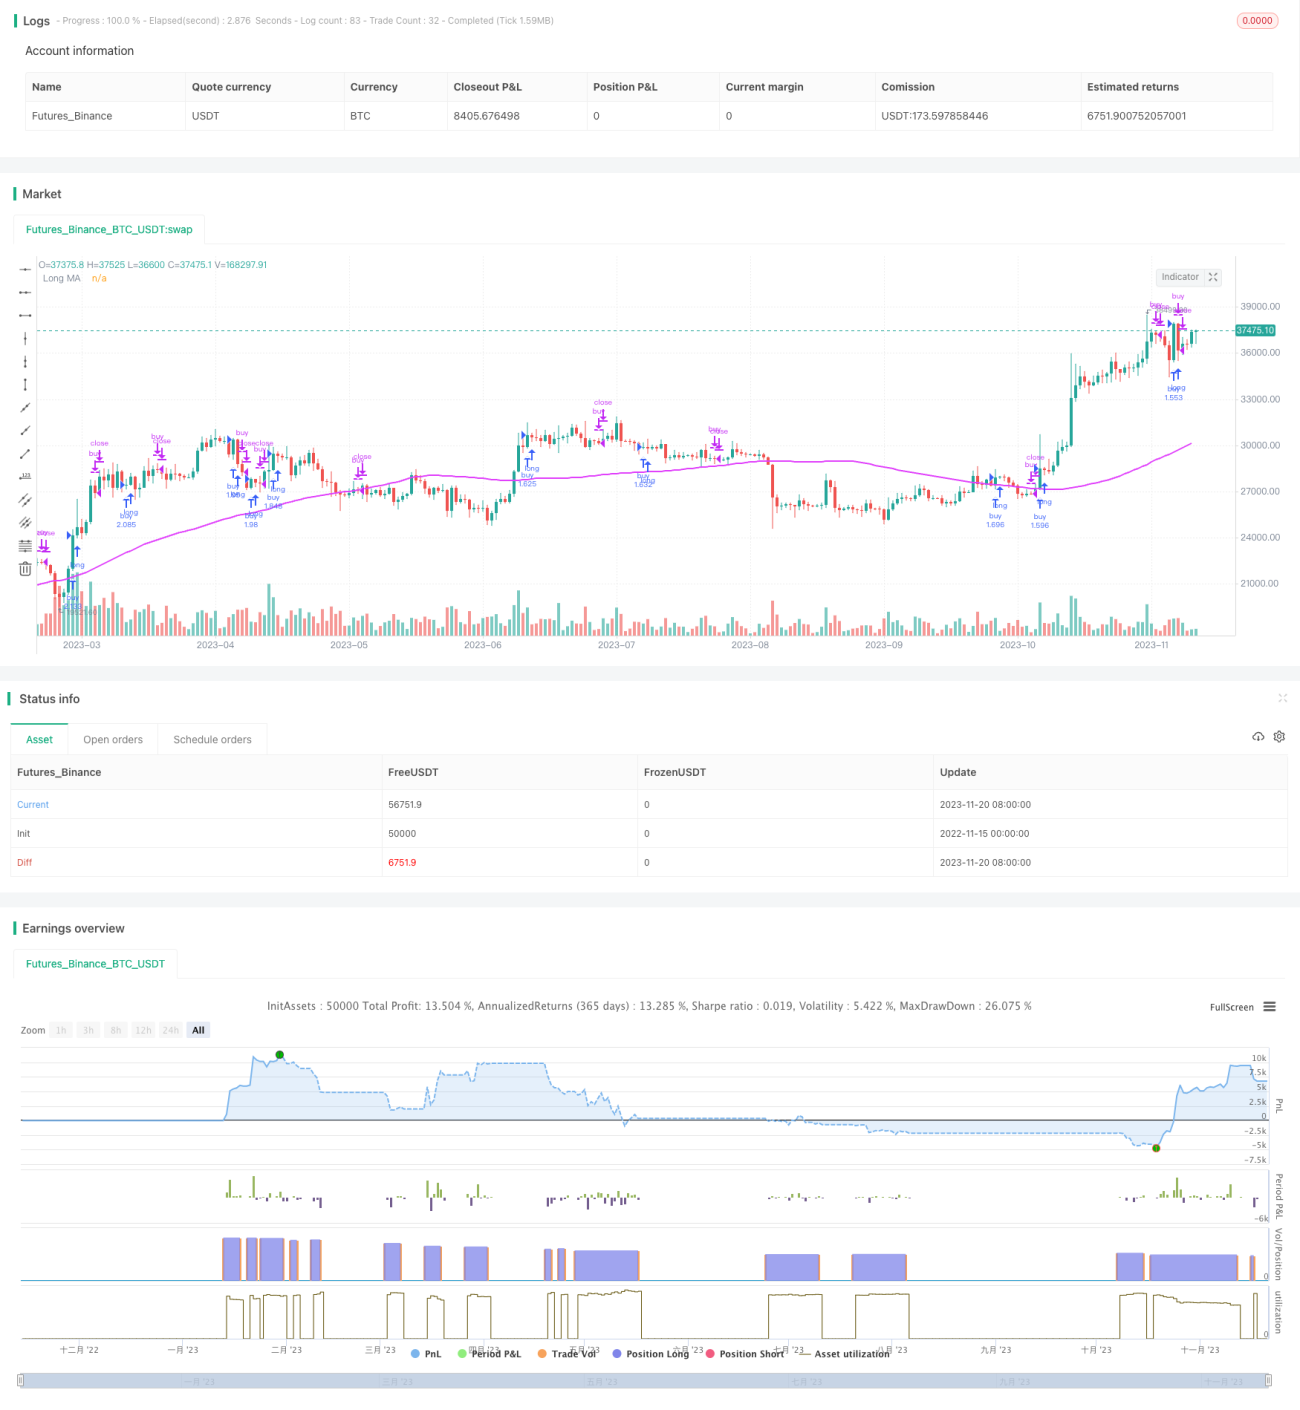
/*backtest
start: 2022-11-15 00:00:00
end: 2023-11-21 00:00:00
period: 1d
basePeriod: 1h
exchanges: [{"eid":"Futures_Binance","currency":"BTC_USDT"}]
*/

//@version=3
strategy("Up Down", "Up Down", precision = 6, pyramiding = 1, default_qty_type = strategy.percent_of_equity, default_qty_value = 99, commission_type = strategy.commission.percent, commission_value = 0.0, initial_capital = 1000, overlay = true)

buy = close > open and open > close[1]Strategy parameters
Related strategies
Comment
All comments (0)
No data
- 1