डबल मूविंग एवरेज आर्बिट्रेज रणनीति
अवलोकन
यह रणनीति द्वि-समान-रेखीय रूपों का उपयोग करने के लिए एक रणनीति है। यह दो उप-नीतियों को जोड़ती है, 123 रूपों को उलटने और सीमित लेनदेन तत्व ((FVE), जब दोनों एक साथ खरीदने या बेचने के संकेत देते हैं, तो यह एक रणनीति है।
रणनीति सिद्धांत
123 आकार उलटा
यह उप-रणनीति उल्फ जेन्सेन की पुस्तक से ली गई है कि कैसे मैं वायदा बाजार में लाभ को तीन गुना कर सकता हूं। यह निम्नलिखित शर्तों पर संकेत देता हैः
- जब समापन मूल्य लगातार 2 दिनों तक बढ़ता है और स्टोच सूचकांक 9 दिनों तक 50 से नीचे होता है, तो अधिक करें;
- जब समापन मूल्य लगातार 2 दिनों तक गिरता है और 9 वें दिन स्टोच सूचक 50 से ऊपर होता है, तो शून्य करें।
एफवीई
एफवीई एक शुद्ध लेनदेन मात्रा सूचक है। यह कीमतों के उतार-चढ़ाव और लेनदेन की मात्रा के आकार के आधार पर यह निर्धारित करता है कि धन प्रवाह या प्रवाह है।
FVE संकेतों को तब संकेत दिया जाता है जब हाल के दो बार के FVE संकेतक एक साथ ऊपर या नीचे जाते हैं।
श्रेष्ठता विश्लेषण
यह रणनीति बाजार के रुझान और धन प्रवाह के दो संकेतकों के संयोजन के साथ प्रभावी रूप से गलत संकेतों से बचने के लिए है। और दोनों उप रणनीतियों में कुछ उलटा विशेषताएं हैं, इसलिए लाभ के लिए सट्टा संचालन किया जा सकता है।
इसके अलावा, द्वि-समान-रेखा रूप, जब यह दिखाई देता है, तो यह अल्पकालिक और मध्यम अवधि के रुझानों को दर्शाता है, इसलिए इसकी अधिक स्थिरता होती है।
जोखिम विश्लेषण
यह रणनीति सम-रेखा पर निर्भर करती है, जब बाजार में उतार-चढ़ाव होता है, तो गलत संकेतों से नुकसान होता है। इसके अलावा, रिवर्स विफलता एक सामान्य जोखिम है।
रणनीति को अधिक मजबूत बनाने के लिए पैरामीटर को ठीक से समायोजित किया जा सकता है, या जोखिम को नियंत्रित करने के लिए स्टॉप लॉस सेट किया जा सकता है।
अनुकूलन दिशा
सबसे अच्छा मिलान खोजने के लिए अधिक प्रकार के औसत रेखा संकेतकों का परीक्षण किया जा सकता है। अन्य सहायक निर्णय संकेतकों, जैसे कि मजबूत और कमजोर संकेतकों, अस्थिरता संकेतकों आदि को गलत संकेतों से बचने के लिए पेश किया जा सकता है।
इसके अलावा, यह अध्ययन किया जा सकता है कि कैसे बाजार की स्थिति के अनुसार पैरामीटर को गतिशील रूप से समायोजित किया जा सकता है ताकि रणनीति अधिक अनुकूली हो सके। पैरामीटर को अनुकूलित करने के लिए मशीन सीखने और तंत्रिका नेटवर्क एल्गोरिदम की खोज की जा सकती है।
संक्षेप
यह द्विआधारी विनिमय रणनीति दो रिवर्स-रोड इंडिकेटरों को एकीकृत करती है, जिससे कुछ हद तक जोखिम से बचा जा सकता है। हालांकि, विनिमय-रेखा पैटर्न पर निर्भर होने के कारण, रणनीति को अधिक स्थिर बनाने के लिए और अनुकूलन की आवश्यकता है। कुल मिलाकर, यह रणनीति शॉर्ट-लाइन विनिमय के लिए एक बुनियादी ढांचा प्रदान करती है और आगे की जांच के लायक है।
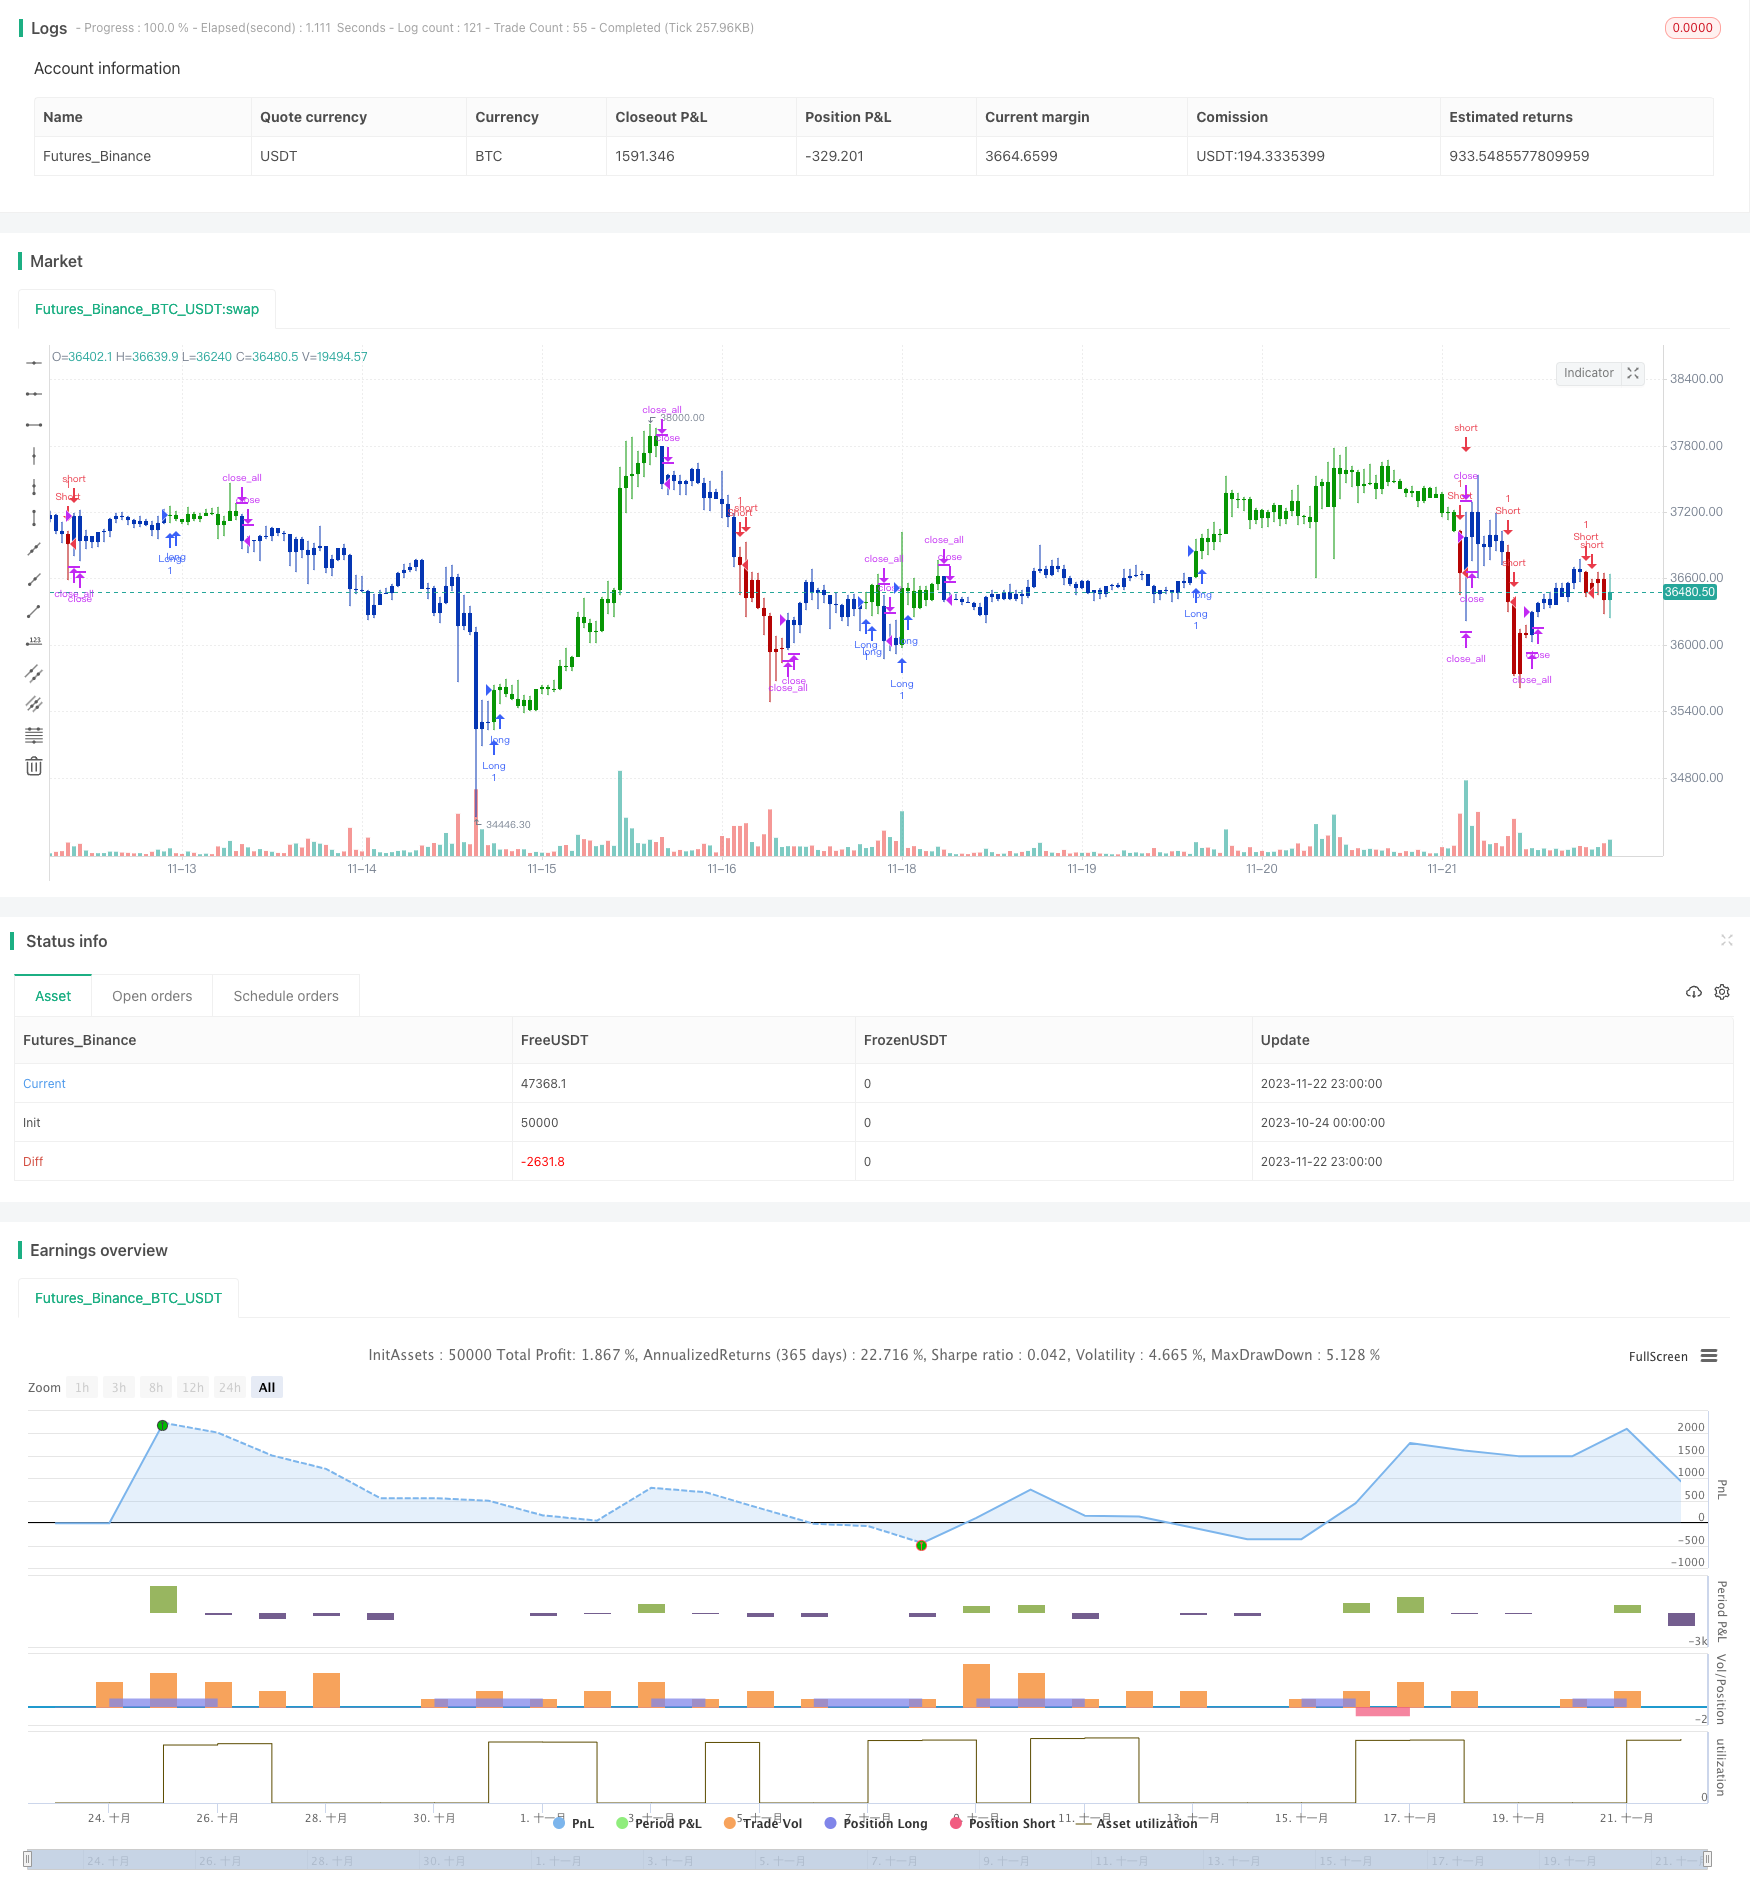
/*backtest
start: 2023-10-24 00:00:00
end: 2023-11-23 00:00:00
period: 1h
basePeriod: 15m
exchanges: [{"eid":"Futures_Binance","currency":"BTC_USDT"}]
*/

//@version=4
////////////////////////////////////////////////////////////
//  Copyright by HPotter v1.0 25/08/2020
// This is combo strategies for get a cumulative signal.
//
// First strategy
// This System was created from the Book "How I Tripled My Money In The
// Futures Market" by Ulf Jensen, Page 183. This is reverse type of strategies.
// The strategy buys at market, if close price is higher than the previous close
// during 2 days and the meaning of 9-days Stochastic Slow Oscillator is lower than 50.
// The strategy sells at market, if close price is lower than the previous close price
// during 2 days and the meaning of 9-days Stochastic Fast Oscillator is higher than 50.
//
// Second strategy
// The FVE is a pure volume indicator. Unlike most of the other indicators
// (except OBV), price change doesn?t come into the equation for the FVE (price
// is not multiplied by volume), but is only used to determine whether money is
// flowing in or out of the stock. This is contrary to the current trend in the
// design of modern money flow indicators. The author decided against a price-volume
// indicator for the following reasons:
// - A pure volume indicator has more power to contradict.
// - The number of buyers or sellers (which is assessed by volume) will be the same,
//     regardless of the price fluctuation.
// - Price-volume indicators tend to spike excessively at breakouts or breakdowns.
//
// WARNING:
// - For purpose educate only
// - This script to change bars colors.
////////////////////////////////////////////////////////////
Reversal123(Length, KSmoothing, DLength, Level) =>
    vFast = sma(stoch(close, high, low, Length), KSmoothing)
    vSlow = sma(vFast, DLength)
    pos = 0.0
    pos := iff(close[2] < close[1] and close > close[1] and vFast < vSlow and vFast > Level, 1,
	         iff(close[2] > close[1] and close < close[1] and vFast > vSlow and vFast < Level, -1, nz(pos[1], 0)))
	pos


FVE(Period,Factor) =>
    pos = 0
    nRes = 0.0
    xhl2 = hl2
    xhlc3 = hlc3
    xClose = close
    xVolume = volume
    xSMAV = sma(xVolume, Period)
    nMF = xClose - xhl2 + xhlc3 - xhlc3[1]
    nVlm = iff(nMF > Factor * xClose / 100,  xVolume,
             iff(nMF < -Factor * xClose / 100, -xVolume, 0))
    nRes := nz(nRes[1],0) + ((nVlm / xSMAV) / Period) * 100
    pos := iff(nRes > nRes[1] and nRes > nRes[2], 1,
             iff(nRes < nRes[1] and nRes < nRes[2], -1, nz(pos[1], 0)))
    pos

strategy(title="Combo Backtest 123 Reversal & Finite Volume Elements (FVE)", shorttitle="Combo", overlay = true)
Length = input(15, minval=1)
KSmoothing = input(1, minval=1)
DLength = input(3, minval=1)
Level = input(50, minval=1)
//-------------------------
Period = input(18, minval=1)
Factor = input(0.6, minval=0.1)
reverse = input(false, title="Trade reverse")
posReversal123 = Reversal123(Length, KSmoothing, DLength, Level)
posFVE = FVE(Period,Factor)
pos = iff(posReversal123 == 1 and posFVE == 1 , 1,
	   iff(posReversal123 == -1 and posFVE == -1, -1, 0))
possig = iff(reverse and pos == 1, -1,
          iff(reverse and pos == -1 , 1, pos))
if (possig == 1)
    strategy.entry("Long", strategy.long)
if (possig == -1)
    strategy.entry("Short", strategy.short)
if (possig == 0)
    strategy.close_all()
barcolor(possig == -1 ? #b50404: possig == 1 ? #079605 : #0536b3 )