एसएमए अस्थिरता विचलन ट्रेडिंग रणनीति

एसएमए अस्थिरता विचलन ट्रेडिंग रणनीति
रणनीति अवलोकन
यह रणनीति सरल चलती औसत और कुछ गणितीय गणनाओं का उपयोग करके खरीद/बिक्री बिंदुओं को निर्धारित करती है। हम 100 दिन के SMA को एक बेंचमार्क के रूप में उपयोग करते हैं। यदि समापन मूल्य उस रेखा से नीचे है, तो हम उस स्थिति को खोलने के लिए चुनते हैं जो उस रेखा से नीचे है, और यह मूल्य (<<<<<<<<<<<<<<<<<<<<<<<<<<<<<<<<<<<<<<<<<<<<<<<<<<<<<<<<<<<<<<<<<<<<<<<<<<<<<<<<<<<<<<<<<<<<<<<<<<<<<<<<<<<<<<<<<<<<<<<<<<<<<<<<<<<<<<<<<<<<<<<<<<<<<<<<<<<<<<<<<<<<<<<<<<<<<<<<<
रणनीति सिद्धांत
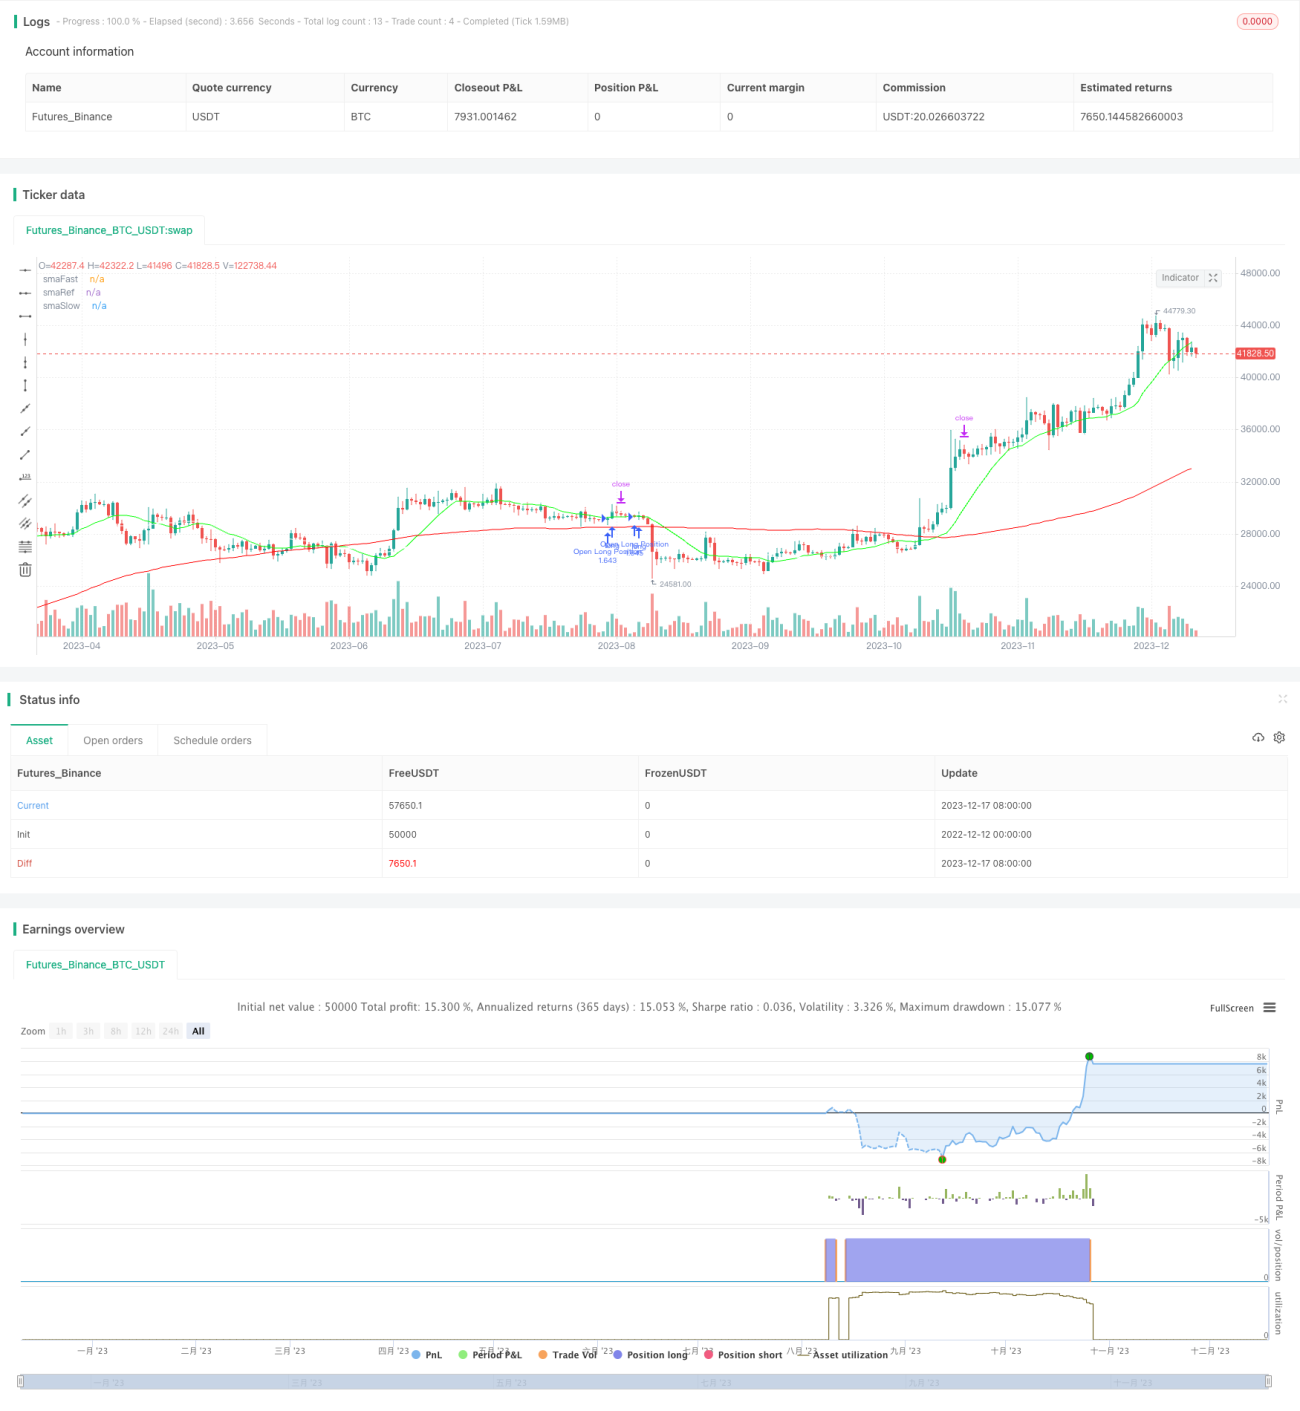
इस रणनीति में तीन SMA लाइनों का उपयोग किया जाता हैः फास्ट लाइन (डिफ़ॉल्ट 14 दिन), स्लो लाइन (डिफ़ॉल्ट 100 दिन) और रेफरेंस लाइन (डिफ़ॉल्ट 30 दिन) ।
जब समापन मूल्य संदर्भ रेखा से नीचे होता है और धीमी रेखा के सापेक्ष कम विचलन विन्यास की तुलना में अधिक होता है, और तेज रेखा ऊपर जाती है और धीमी रेखा नीचे जाती है, तो मल्टीहेड में प्रवेश करती है। जब इन शर्तों को पूरा किया जाता है, तो तेज और धीमी रेखाओं के पार होने की संभावना होती है, इसलिए एक अच्छा प्रवेश बिंदु होता है।
जब समापन मूल्य संदर्भ रेखा से अधिक है, और धीमी रेखा के सापेक्ष उच्च विचलन विन्यास के उच्च विचलन से अधिक है, और समापन मूल्य लगातार 3 K लाइनों पर बढ़ गया है, लाभप्रदता प्राप्त की गई है, और तेज रेखा धीमी रेखा से अधिक है, तो एक और स्थिति को बंद करें। यदि कीमतें जारी रहती हैं, तो स्टॉप लॉस को ट्रैक करना शुरू कर दिया जाएगा।
प्रत्येक ट्रेड पर पोजीशन एक निश्चित अनुपात के आधार पर प्रवेश करती है, इस तरह से स्थिति को नियंत्रित करती है।
रणनीति का विश्लेषण
- एसएमए का लाभ उठाने के लिए, मूल्य वक्र को चिकना करें और बाजार के शोर को फ़िल्टर करें।
- एसएमए क्रॉसिंग में प्रवृत्ति की भविष्यवाणी करने की क्षमता है।
- एसएमए लाइन के सापेक्ष विचलन सेट करें, झूठे ब्रेक से बचें।
- ट्रेंड और क्रॉस-इंडिकेटर के संयोजन से निर्णय लेने की सटीकता में सुधार होता है।
- स्टॉप लॉस ट्रैक का उपयोग करके लाभ को लॉक करें और निकासी से बचें।
रणनीतिक जोखिम विश्लेषण
- SMA स्वयं काफी पिछड़ा है, और शायद मूल्य टर्निंग पॉइंट को याद कर रहा है।
- गलत पलायन सेटिंग्स के कारण अति-आक्रामक या अति-सावधानी हो सकती है।
- ट्रैक स्टॉप पैरामीटर की गलत सेटिंग से स्टॉप बहुत जल्दी या बहुत ज्यादा हो सकता है।
- बाजार में भारी कीमतों के उतार-चढ़ाव का सामना करने में असमर्थ।
अनुकूलन के लिए उपाय:
- अन्य अग्रणी सूचकांकों के साथ प्रवेश फ़िल्टर करें
- पलायन के लिए पुनरावर्ती परीक्षण अनुकूलन।
- स्टॉप लॉस पैरामीटर पर बार-बार परीक्षण करें और इष्टतम पैरामीटर ढूंढें।
- उच्च उतार-चढ़ाव के दौरान स्थिति को कम करें
रणनीति अनुकूलन दिशा
- विभिन्न चक्रों के एसएमए का परीक्षण करने के लिए इष्टतम पैरामीटर की तलाश करें
- बाजार संरचना और रुझान का आकलन करने के लिए अन्य संकेतकों को शामिल करना
- अधिक मुनाफे को लॉक करने के लिए स्टॉप लॉस पैरामीटर का अनुकूलन करें
- बाजार में उतार-चढ़ाव के आधार पर स्थिति को समायोजित करना
- एक ही समय में कई किस्मों और संयोजनों के लिए लागू
संक्षेप
एसएमए अस्थिरता विचलन ट्रेडिंग रणनीति विभिन्न एसएमए औसत के संदर्भ में विचलन सेट करके, सबसे अच्छा प्रवेश समय खोजने के लिए। साथ ही, बाहर निकलने के तंत्र ने लाभ को लॉक करने के लिए स्टॉपलॉस को ट्रैक करने के लिए सेट किया है। यह रणनीति सरल है और इसे लागू करना आसान है। एसएमए पैरामीटर, विचलन सेटिंग और स्टॉपलॉस समता को अनुकूलित करके बेहतर प्रभाव प्राप्त किया जा सकता है। यह रणनीति मध्यम और लंबी अवधि के लिए उपयुक्त है।
/*backtest
start: 2022-12-12 00:00:00
end: 2023-12-18 00:00:00
period: 1d
basePeriod: 1h
exchanges: [{"eid":"Futures_Binance","currency":"BTC_USDT"}]
*/

// @version=4
// Author: Sonny Parlin (highschool dropout)
strategy(shorttitle="SMA+Strategy", title="SMA Offset Strategy",
overlay=true, currency=currency.USD,- 1