तीन चलती औसत कम विलंबता तेजी से व्यापार रणनीति
रणनीति सिद्धांत
इस रणनीति में तीन निम्न समय-विलंब चलती औसत का उपयोग किया जाता है, जिसमें 12 चक्र, 26 चक्र और 55 चक्र के निम्न समय-विलंब थीमा औसत शामिल हैं। ये तीन औसत क्रमशः तेजी से औसत, मध्यम गति और धीमी गति के लिए होते हैं। जब तेजी से औसत औसत औसत को पार करता है, तो एक खरीद संकेत उत्पन्न होता है; जब तेजी से औसत औसत को पार करता है, तो एक बिक्री संकेत उत्पन्न होता है। इस प्रकार, तीन औसत रेखाओं के क्रॉसिंग के माध्यम से बाजार में खरीदने और बेचने के लिए, उच्च आवृत्ति वाले व्यापार को लागू करने के लिए।
कोड में टेम्पलेट फ़ंक्शन थीमा () को परिभाषित किया गया है ताकि निम्न समय विलंबता थीमा औसत रेखा की गणना की जा सके। इसकी गणना सूत्र हैः थीमा = 2*ईएमए (EMA), एक द्विआधारी सूचकांक चलती औसत (EWMA) का उपयोग करके गणना की जाती है, जो मूल रूप से एक द्विआधारी सूचकांक चिकनी चलती औसत है, जिसका मुख्य लाभ यह है कि यह विलंबता को काफी कम कर देता है। इससे मूल्य परिवर्तनों के लिए अधिक तेज़ी से प्रतिक्रिया मिल सकती है और ट्रेडिंग सिग्नल निर्णय की वास्तविकता में सुधार होता है।
विशेष रूप से, इस रणनीति के लिए प्रवेश का निर्णय यह है किः एक खरीद संकेत उत्पन्न होता है जब तेज़ औसत रेखा पर तेज़ औसत रेखा होती है और तेज़ औसत रेखा धीमी औसत रेखा से ऊपर होती है; एक बेचने का संकेत उत्पन्न होता है जब तेज़ औसत रेखा के नीचे तेज़ औसत रेखा होती है और तेज़ औसत रेखा धीमी औसत रेखा से नीचे होती है।
श्रेष्ठता विश्लेषण
इस रणनीति का सबसे बड़ा लाभ यह है कि यह जल्दी से और सटीक रूप से निर्णय लेता है। त्रि-मध्य रेखा कम समय में देरी डिजाइन में देरी को काफी कम किया गया है, जो कीमत में बदलाव के लिए तेजी से प्रतिक्रिया करने में सक्षम है। साथ ही त्रि-मध्य रेखा का उपयोग करके क्रॉस-निर्णय किया जाता है, जिससे गलत निर्णय से बचा जाता है।
इसके अलावा, यह रणनीति उच्च आवृत्ति वाले ट्रेडिंग के लिए उपयुक्त है, जो शॉर्ट-लाइन मूल्य उतार-चढ़ाव से लाभ उठा सकती है। तेजी से और तेजी से बाहर निकलने वाले ऑपरेशन मोड के माध्यम से, बाजार में अधिक उतार-चढ़ाव से लाभ उठाया जा सकता है।
जोखिम विश्लेषण
इस रणनीति का सबसे बड़ा जोखिम यह है कि इसमें अति-छोटी सरलीकरण हो सकती है। त्रि-मध्य रेखा कम समय में देरी के लिए डिज़ाइन किया गया है ताकि यह मूल्य परिवर्तनों के लिए अति-संवेदनशील हो, कुछ बाजारों में अति-छोटी उतार-चढ़ाव हो सकता है। इस स्थिति में इसे आसानी से पकड़ा जा सकता है।
इसके अलावा, उच्च आवृत्ति ट्रेडिंग के लिए अधिक शुल्क और स्लिप पॉइंट का भुगतान करना पड़ता है। यदि लाभप्रदता कम है, तो ट्रेडिंग शुल्क के साथ रिवर्स-ब्रोकरिंग करना आसान है।
इसके अलावा, इस रणनीति में व्यापारियों की वास्तविक समय की निगरानी क्षमता की उच्च आवश्यकता होती है, जिससे स्टॉपलॉस और स्टॉपबॉक्स को समय पर अपडेट करने की आवश्यकता होती है।
अनुकूलन दिशा
इस रणनीति को निम्नलिखित पहलुओं से अनुकूलित किया जा सकता हैः
त्रिकोणीय औसत रेखा के आवधिक मापदंडों को अनुकूलित करना ताकि यह विभिन्न बाजारों की विशेषताओं के लिए अधिक अनुकूल हो सके;
संकेतों को पुष्टि करने के लिए अस्थिरता सूचकांक या लेन-देन की मात्रा के सूचकांक को जोड़ना ताकि उतार-चढ़ाव की स्थिति में फंसने से बचा जा सके;
गतिशील ट्रैकिंग के लिए स्टॉप-स्टॉप सिस्टम को जोड़ने के लिए अधिक कारक;
पोजीशन मैनेजमेंट को अनुकूलित करना और फंड मैनेजमेंट के माध्यम से एकल जोखिम को नियंत्रित करना;
गतिशील रूप से अनुकूलित रणनीति पैरामीटर के लिए मशीन लर्निंग एल्गोरिदम के साथ संयुक्त।
संक्षेप
इस रणनीति के तीन औसत रेखा कम समय में देरी तेजी से व्यापार रणनीति. यह कम समय में देरी के साथ डिजाइन किया गया है, तेजी से और तेजी से बाहर निकलने के लिए, उच्च आवृत्ति व्यापार के लिए उपयुक्त शॉर्ट लाइन अवसर को पकड़ने. इस रणनीति का सबसे बड़ा लाभ संकेत निर्णय की तेजी से और सटीक है, सबसे बड़ा नुकसान यह है कि यह आसानी से अस्थिरता में फंस गया है. इस लेख में विस्तृत सिद्धांत विश्लेषण, लाभ विश्लेषण, जोखिम विश्लेषण और अनुकूलन के माध्यम से व्यापार रणनीति का एक व्यापक अवलोकन किया गया है.
||
The strategy is named “Low Lag Triple Moving Average Fast Trading Strategy”. Its main idea is to determine entries and exits based on the golden cross and death cross of three moving averages with different parameters and low lag design.
Strategy Principle
The strategy uses three low-lag moving averages, including 12-, 26-, and 55-period low-lag TEMA. These three MAs represent fast, medium and slow MAs. When the fast MA crosses over the medium MA, a buy signal is generated. When the fast MA crosses below the medium MA, a sell signal is generated. By using the crossover of the three MAs to determine market entry and exit points, high frequency trading can be achieved.
The template function tema() is defined in the code to calculate the low-lag TEMA. Its calculation formula is: TEMA = 2*EMA - EMA(EMA). It uses the double exponential moving average EWMA for calculation. Essentially it is a double smoothed EMA with the main merit of largely reducing the lagging effect. Thus it can respond to price changes faster and improve the timeliness of trading signals.
Specifically, the entry rules of this strategy are: when the fast MA crosses over the medium MA and the fast MA is above the slow MA, a buy signal is generated. When the fast MA crosses below the medium MA and the fast MA is below the slow MA, a sell signal is generated.
Advantage Analysis
The biggest advantage of this strategy is that the entries and exits are determined quickly and accurately. The low-lag design of the three MAs greatly reduces the lagging effect so that they can respond to price changes rapidly. Also, using the crossover of three MAs to determine signals avoids false signals.
In addition, this strategy is suitable for high-frequency trading to capture profits from short-term price fluctuations. Through fast entries and exits it can profit from high volatility markets.
Risk Analysis
The biggest risk is that ultra short-term whipsaws may occur. Due to the high sensitivity to price changes from the low-lag design, some markets may experience high-frequency oscillations. Then whipsaws are very likely to happen.
Also, high-frequency trading requires paying relatively high commissions and slippage costs. If the profiting ability is insufficient, it is easy to suffer losses from the trading costs.
Moreover, this strategy requires the trader to have strong real-time monitoring abilities to update the stop loss and take profit timely.
Optimization Directions
The strategy can be optimized from the following aspects:
Optimize the period parameters of the three MAs to better suit different market characteristics.
Add volatility indicators or volume indicators to confirm signals and avoid whipsaws in ranging markets.
Incorporate more factors to set up dynamic trailing stop mechanisms.
Optimize position sizing to control single trade risks through money management techniques.
Incorporate machine learning algorithms to dynamically optimize the strategy parameters.
Conclusion
This is a low-lag triple moving average fast trading strategy. Through its low-lag design, fast entries and exits can be achieved, which is suitable for high-frequency trading to capture short-term opportunities. The biggest advantage of this strategy is that its signal determination is fast and accurate. The biggest disadvantage is that it is prone to be whipsawed in ranging markets. This article comprehensively summarizes this trading strategy through detailed analysis of its rationale, advantages, risks and optimization directions.
[/trans]
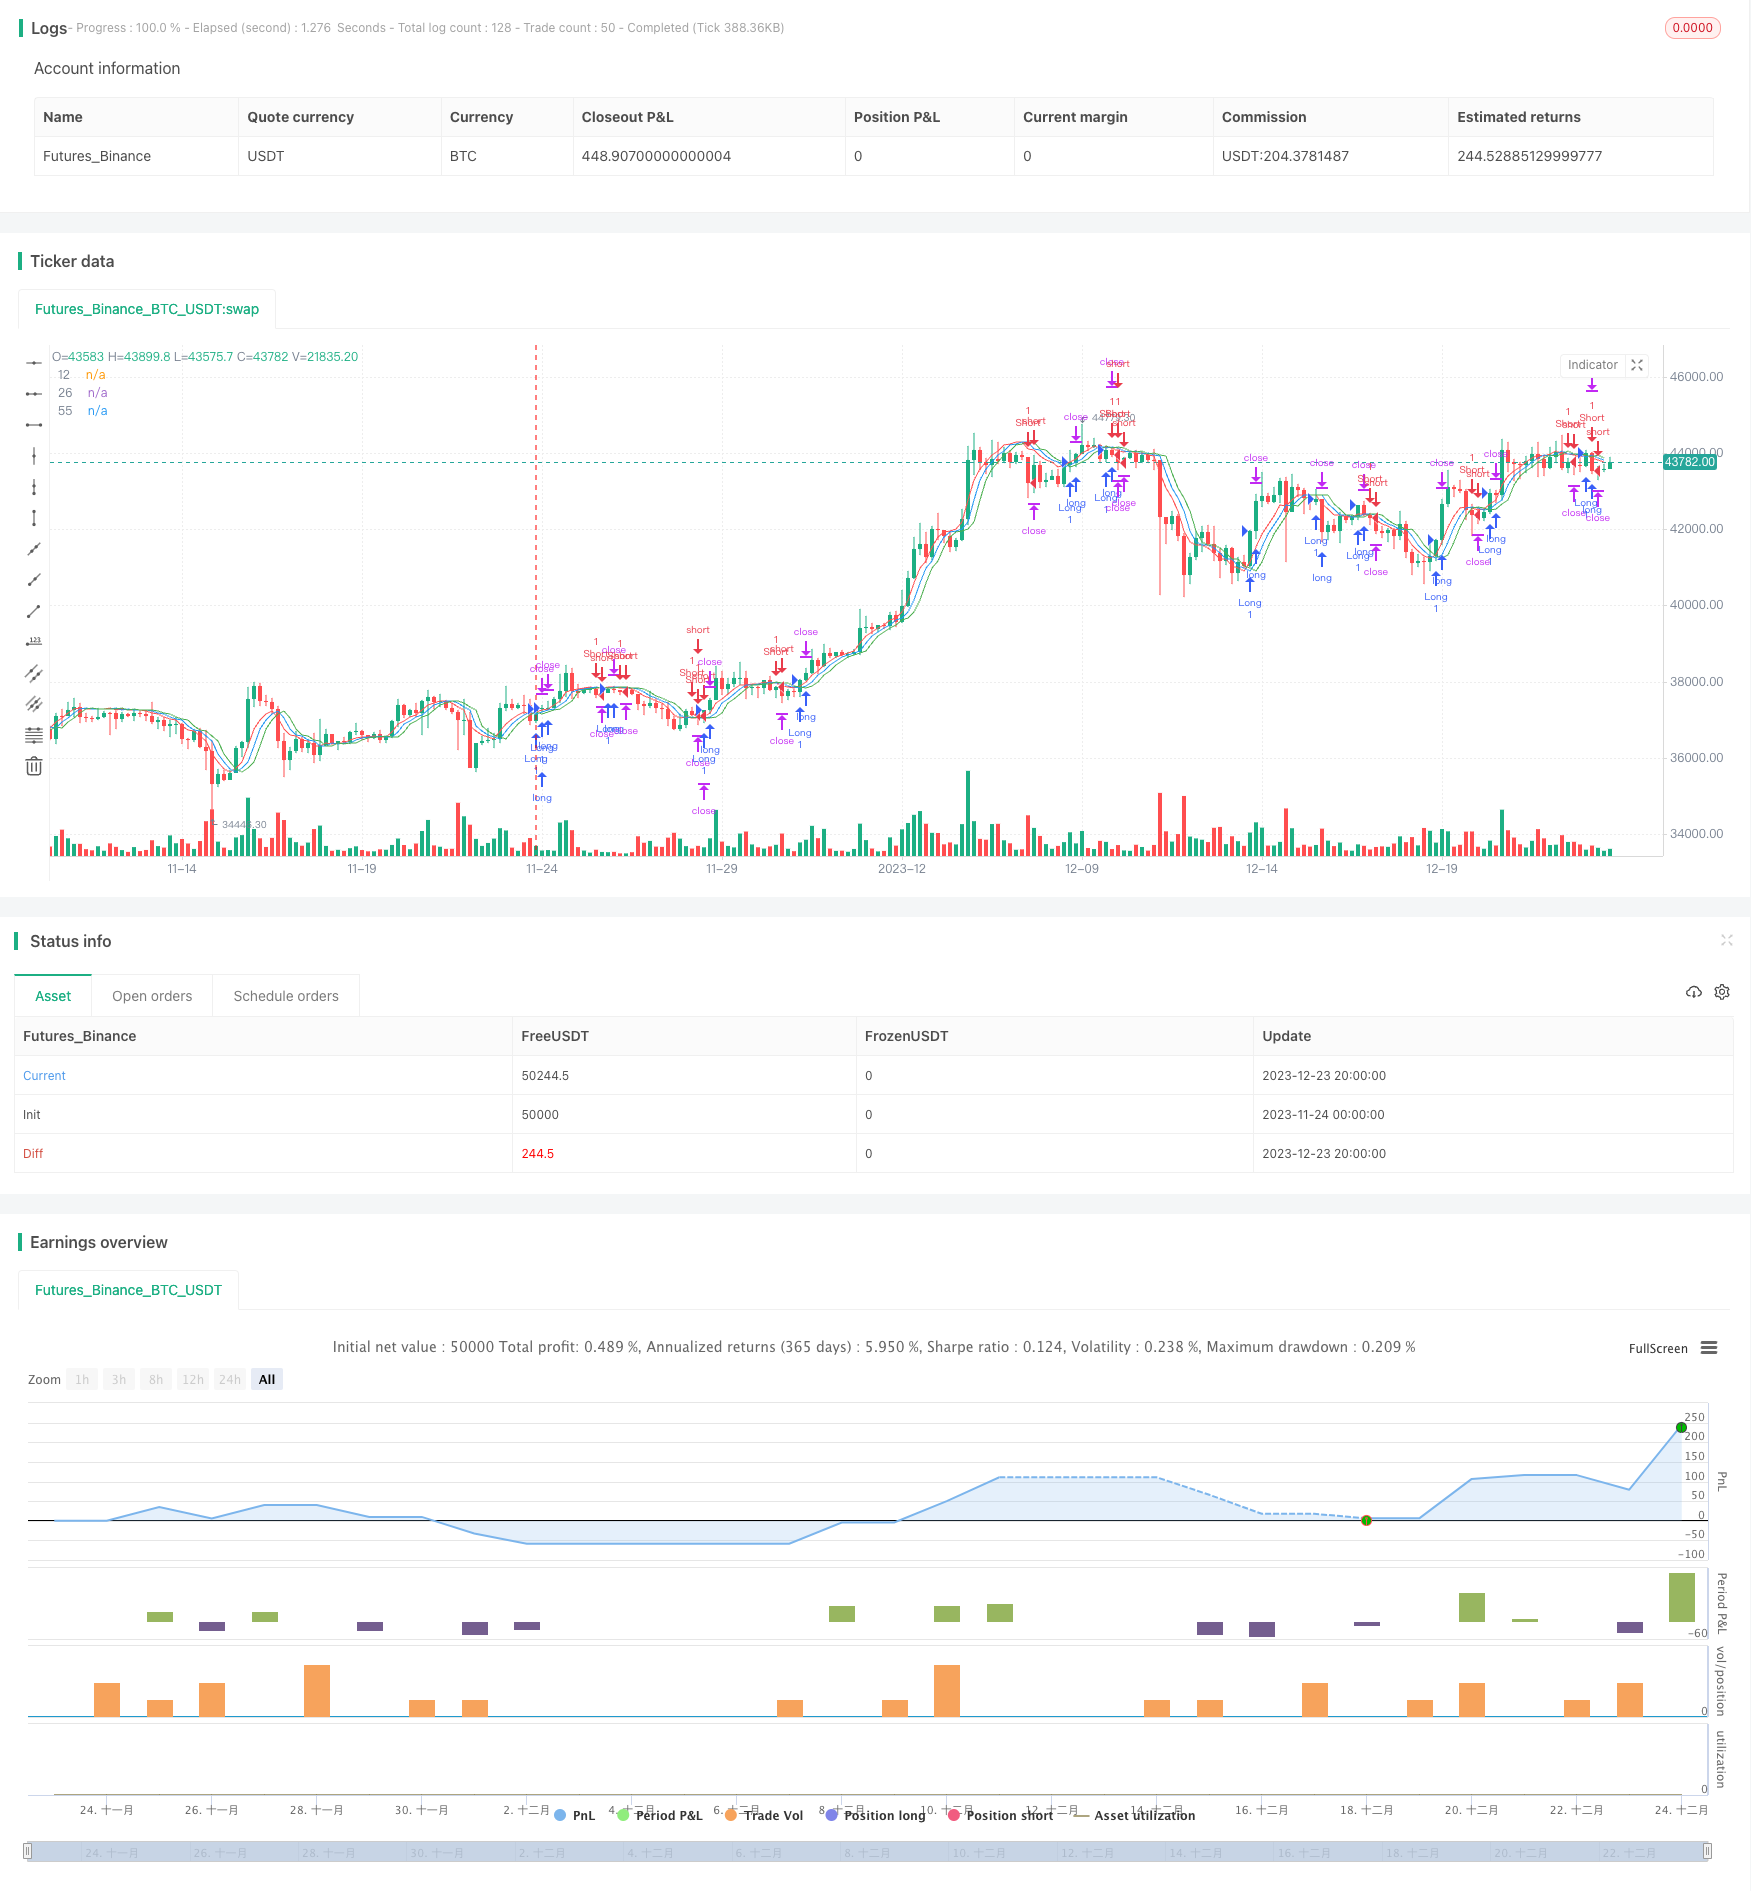
/*backtest
start: 2023-11-24 00:00:00
end: 2023-12-24 00:00:00
period: 4h
basePeriod: 15m
exchanges: [{"eid":"Futures_Binance","currency":"BTC_USDT"}]
*/

//@version=4
strategy("scalping low lag tema etal", shorttitle="Scalping tema",initial_capital=10000, overlay=true)
mav = input(title="Moving Average Type", defval="temadelay", options=["nkclose", "ema", "emadelay", "fastema", "tema", "temadelay"])
lenb = 3
N = input(8)
K = input(1.2)
fracCap = input(1.0)
in = close + K*mom(close,N)
source = close
length = 8
sigma  = 12.0
offset = 0.9
p = 4
// length = 10
// sigma  = 6.0
// offset = 0.85
tema(src,len) => fastemaOut = 2*ema(src, len) - ema(ema(src, len), len)


a = 0.0
b = 0.0
c = 0.0
if mav == "nkclose"
    a := ema(in, 12)
    b := a[1]
    c := a[2]
if mav == "ema"
    a := ema(close, 12)
    b := ema(close, 26)
    c := ema(close, 55)
if mav == "emadelay"
    a := ema(close, 12)
    b := a[1]
    c := a[2]
if mav == "fastema"
    a := ema(in, 12)
    b := ema(in, 26)
    c := ema(in, 55)
if mav == "tema"
    a := tema(close, 12)
    b := tema(close, 26)
    c := tema(close, 55)
if mav == "temadelay"
    a := tema(close, 12)
    b := a[1]
    c := a[2]

TP = input(200)
SL = input(130)
TS = input(1)
// TP = input(50)
// SL = input(110)
// TS = input(1)

orderSize = floor((fracCap * strategy.equity) / close)
long = cross(a, c) and a > b
short = cross(a, c) and a < b
plot(a, title="12", color=color.red, linewidth=1)
plot(b, title="26", color=color.blue, linewidth=1)
plot(c, title="55", color=color.green, linewidth=1)

strategy.entry("Long", strategy.long, qty=orderSize,  when=long)
strategy.entry("Short", strategy.short, qty=orderSize,  when=short)
// strategy.entry("Long", strategy.long,  100.0, when=long)
// strategy.entry("Short", strategy.short,  100.0, when=short)
// strategy.entry("Long", strategy.long, 100.0, when=long)
// strategy.entry("Short", strategy.short, 100.0, when=short)
// strategy.entry("Long", strategy.long, 1.0, when=long)
// strategy.entry("Short", strategy.short, 1.0, when=short)

TPP = (TP > 0) ? TP : na
SLP = (SL > 0) ? SL : na
TSP = (TS > 0) ? TS : na
// strategy.exit("Close Short", "Short", qty_percent=100, profit=TPP, loss=SLP, trail_points=TSP, when=long)
// strategy.exit("Close Long", "Long", qty_percent=100, profit=TPP, loss=SLP, trail_points=TSP, when=short)
// strategy.exit("Close Long", "Long", qty_percent=100, profit=TPP, loss=SLP, trail_points=TSP, when=long[1])
// strategy.exit("Close Short", "Short", qty_percent=100, profit=TPP, loss=SLP, trail_points=TSP, when=short[1])
strategy.exit("Close Long", "Long", qty_percent=100, profit=TPP, loss=SLP, trail_points=TSP)
strategy.exit("Close Short", "Short", qty_percent=100, profit=TPP, loss=SLP, trail_points=TSP)