बोलिंगर बैंड डाउनवर्ड क्रॉसओवर आरएसआई पुलबैक ट्रेडिंग रणनीति
अवलोकन
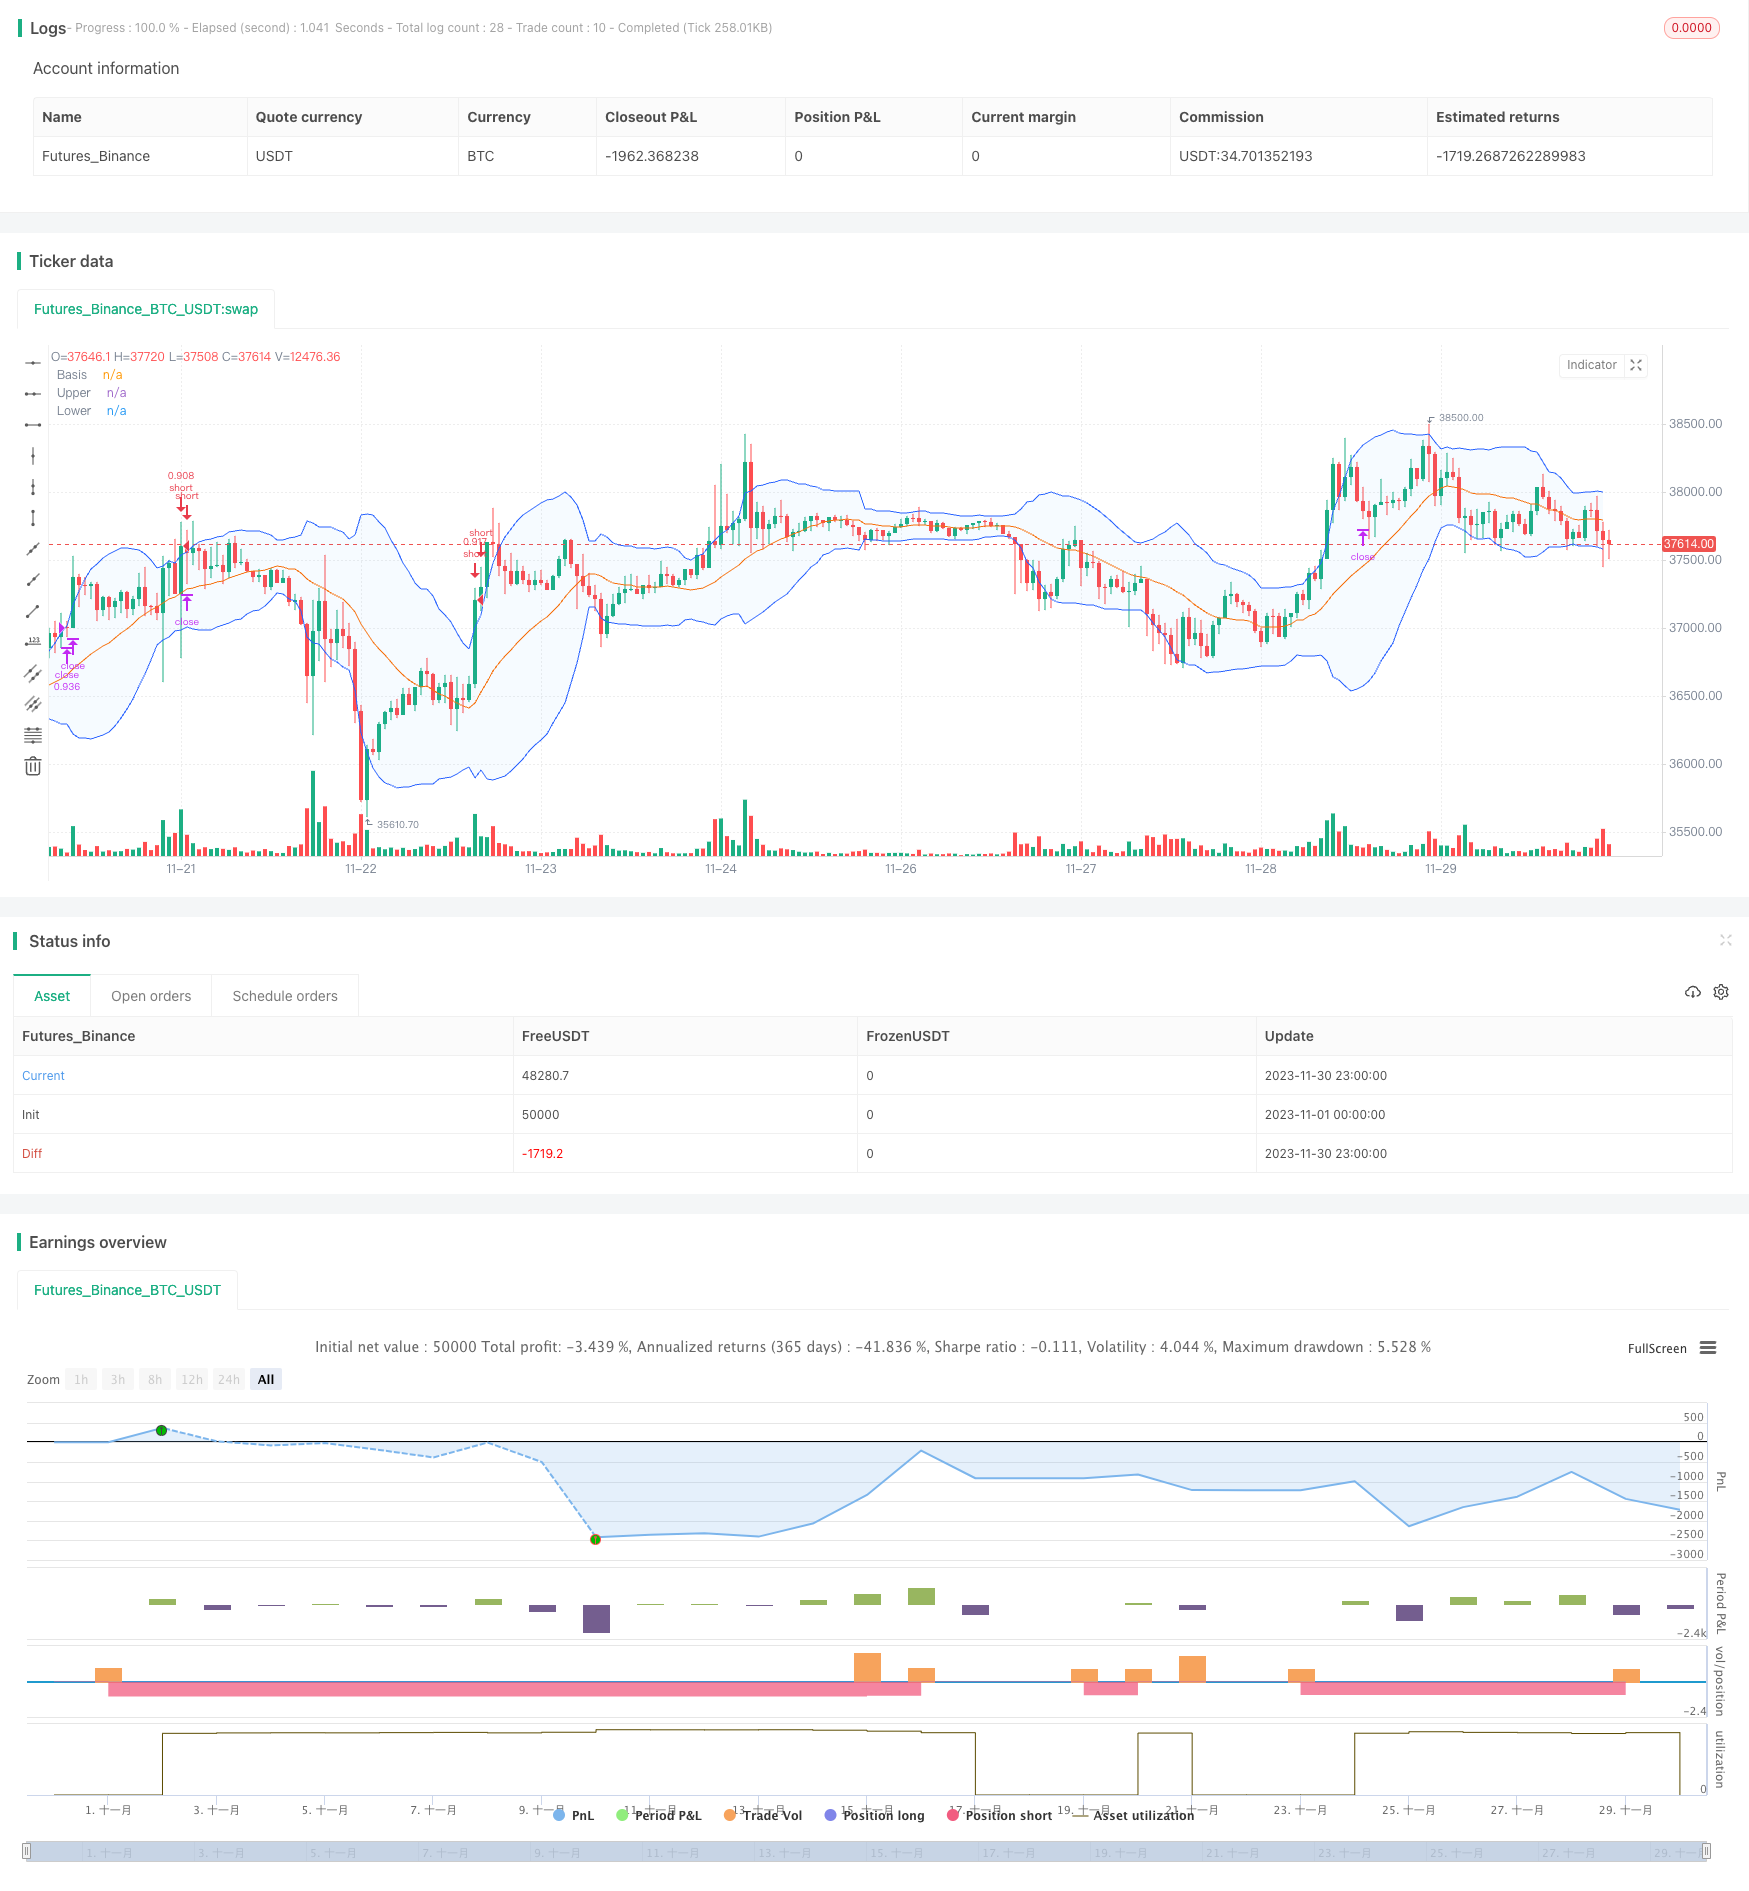
यह रणनीति बुलिन बैंड सूचकांक का उपयोग करती है ताकि यह पता लगाया जा सके कि क्या कीमतें ओवरबॉय और ओवरसोल्ड क्षेत्र में प्रवेश कर रही हैं, और आरएसआई सूचकांक के साथ संयुक्त रूप से यह निर्धारित करने के लिए कि क्या कोई पलटाव की संभावना है, जब ओवरबॉय क्षेत्र एक मृत फोर्क बनाता है, तो इसे खाली कर दिया जाता है, और जब कीमतें बुलिन बैंड से अधिक हो जाती हैं, तो यह बंद हो जाती है।
रणनीति सिद्धांत
यह रणनीति मुख्य रूप से निम्नलिखित सिद्धांतों पर आधारित हैः
- जब बंद होने वाली कीमतों में बुरीन बैंड को पार करने के लिए ट्रैक किया जाता है, तो यह दर्शाता है कि परिसंपत्ति ओवरबॉय क्षेत्र में है और एक पलटाव का अवसर है
- आरएसआई सूचकांक ओवरबॉय और ओवरसोल्ड क्षेत्रों का पता लगाने के लिए प्रभावी है, आरएसआई> 70 ओवरबॉय क्षेत्रों के लिए
- जब समापन मूल्य ऊपर से नीचे की ओर जाता है, तो लीवरेज करें
- जब आरएसआई ओवरबोर्ड से वापस आ जाता है या स्टॉप पॉइंट ट्रिगर होता है, तो स्टॉप को बंद कर दिया जाता है
श्रेष्ठता विश्लेषण
इस रणनीति के निम्नलिखित फायदे हैं:
- ब्रिन बैंड का उपयोग करके ओवरबॉट और ओवरसोल्ड क्षेत्र का निर्धारण करें और ट्रेडों की सफलता दर बढ़ाएं
- आरएसआई के साथ मिलकर, अनावश्यक नुकसान से बचने के लिए झूठे ब्रेक की संभावना को फ़िल्टर करें
- उच्च लाभ-हानि अनुपात, अधिकतम जोखिम नियंत्रण
जोखिम विश्लेषण
इस रणनीति में निम्नलिखित जोखिम हैं:
- ब्रेक-अप के बाद वृद्धि के कारण नुकसान में वृद्धि हुई
- RSI ने समय पर वापसी नहीं की, घाटा और भी बढ़ गया
- एकतरफा होल्डिंग, बाजार को बंद करने में असमर्थ
जोखिम को निम्न तरीकों से कम किया जा सकता हैः
- उचित रूप से स्टॉप पॉइंट को समायोजित करें
- अन्य संकेतकों के संयोजन में आरएसआई गिरावट संकेतों का आकलन करें
- औसत रेखा सूचकांक के साथ, यह निर्धारित करने के लिए कि क्या यह समेकन में है
अनुकूलन दिशा
इस रणनीति को निम्नलिखित पहलुओं से अनुकूलित किया जा सकता हैः
- अधिक व्यापारिक किस्मों के लिए ब्रिन बैंड पैरामीटर का अनुकूलन
- RSI पैरामीटर को अनुकूलित करें और सूचकांक प्रभावशीलता में सुधार करें
- अन्य संकेतकों के संयोजन को जोड़ें और एक रुझान मोड़ का आकलन करें
- मल्टीहेड लेनदेन तर्क जोड़ें
- स्टॉप-लॉस रणनीति के साथ स्टॉप-लॉस को गतिशील रूप से समायोजित करना
संक्षेप
इस रणनीति के समग्र एक प्रकार की है एक विशिष्ट अति-खरीद क्षेत्र तेजी से शॉर्ट लाइन ट्रेडिंग रणनीति. बुरिन बैंड का उपयोग निर्णय खरीदने और बेचने के लिए, आरएसआई फिल्टर संकेतों. उचित रोक के माध्यम से जोखिम के स्तर को नियंत्रित. यह पैरामीटर अनुकूलन, संयोजन सूचकांक, और अधिक स्थिति खोलने तर्क आदि के माध्यम से प्रभावशीलता बढ़ाने के लिए किया जा सकता है.
/*backtest
start: 2023-11-01 00:00:00
end: 2023-11-30 23:59:59
period: 1h
basePeriod: 15m
exchanges: [{"eid":"Futures_Binance","currency":"BTC_USDT"}]
*/

//@version=5
// This source code is subject to the terms of the Mozilla Public License 2.0 at https://mozilla.org/MPL/2.0/
// © Coinrule


strategy("Bollinger Band Below Price with RSI",
         overlay=true,
         initial_capital=1000,
         process_orders_on_close=true,
         default_qty_type=strategy.percent_of_equity,
         default_qty_value=70,
         commission_type=strategy.commission.percent,
         commission_value=0.1)

showDate = input(defval=true, title='Show Date Range')
timePeriod = time >= timestamp(syminfo.timezone, 2022, 1, 1, 0, 0)
notInTrade = strategy.position_size <= 0

//Bollinger Bands Indicator
length = input.int(20, minval=1)
src = input(close, title="Source")
mult = input.float(2.0, minval=0.001, maxval=50, title="StdDev")
basis = ta.sma(src, length)
dev = mult * ta.stdev(src, length)
upper = basis + dev
lower = basis - dev
offset = input.int(0, "Offset", minval = -500, maxval = 500)
plot(basis, "Basis", color=#FF6D00, offset = offset)
p1 = plot(upper, "Upper", color=#2962FF, offset = offset)
p2 = plot(lower, "Lower", color=#2962FF, offset = offset)
fill(p1, p2, title = "Background", color=color.rgb(33, 150, 243, 95))

// RSI inputs and calculations
lengthRSI = 14
RSI = ta.rsi(close, lengthRSI)


// Configure trail stop level with input options
longTrailPerc = input.float(title='Trail Long Loss (%)', minval=0.0, step=0.1, defval=3) * 0.01
shortTrailPerc = input.float(title='Trail Short Loss (%)', minval=0.0, step=0.1, defval=3) * 0.01

// Determine trail stop loss prices
//longStopPrice = 0.0
shortStopPrice = 0.0

//longStopPrice := if strategy.position_size > 0
    //stopValue = close * (1 - longTrailPerc)
    //math.max(stopValue, longStopPrice[1])
//else
    //0

shortStopPrice := if strategy.position_size < 0
    stopValue = close * (1 + shortTrailPerc)
    math.min(stopValue, shortStopPrice[1])
else
    999999


//Entry and Exit
strategy.entry(id="short", direction=strategy.short, when=ta.crossover(close, upper) and RSI < 70 and timePeriod and notInTrade)

if (ta.crossover(upper, close) and RSI > 70 and timePeriod)
    strategy.exit(id='close', limit = shortStopPrice)