सुचारू ऑसिलेटर पर आधारित प्रवृत्ति अनुसरण रणनीति
अवलोकन
यह रणनीति मूल्य रुझानों की पहचान करने के लिए चिकनी-चंचल सूचकांकों पर आधारित है और ट्रेडों को ट्रेंड-ट्रेसिंग के तरीके का उपयोग करती है। जब कीमत सूचकांक रेखा को तोड़ती है तो ओवरहेड करें और जब कीमत सूचकांक रेखा को तोड़ती है तो ओवरहेड करें।
रणनीति सिद्धांत
यह रणनीति मूल्य प्रवृत्ति की पहचान करने के लिए एक कस्टम स्लीव-ओवर इंडिकेटर का उपयोग करती है। यह इंडिकेटर वर्तमान K-लाइन के रिवर्स-ओवर की कीमत की गणना करता है, जो एक सैद्धांतिक मूल्य है जो लाभ और हानि को उलट सकता है। फिर इस रिवर्स-ओवर की कीमत को स्लीव-ओवर करने के लिए अंतिम स्लीव-ओवर इंडिकेटर लाइन प्राप्त करने के लिए संसाधित किया जाता है। जब कीमत (सूचक रेखा) से ऊपर (नीचे) होती है, तो यह संकेत देती है कि स्थिति (ऊपर) (नीचे) प्रवृत्ति में है।
रणनीतियाँ संकेत के रूप में स्थिति बनाने के लिए संकेत के रूप में संकेत देती हैं। जब कीमत सूचकांक रेखा को तोड़ती है तो अधिक करें, और जब कीमत सूचकांक रेखा को तोड़ती है तो शून्य करें। स्टॉप लॉस लाइन को प्रवेश मूल्य के एक निश्चित प्रतिशत के रूप में सेट करें, लाभ को लॉक करने और जोखिम को नियंत्रित करने के लिए।
रणनीतिक लाभ
- अनुकूलित संकेतकों का उपयोग करके रुझानों की पहचान करें और बेहतर प्रदर्शन करें
- प्रवृत्ति ट्रैकिंग का उपयोग करना, लगभग मात्रात्मक प्रवृत्ति व्यापार सिद्धांत के अनुरूप
- स्टॉप लॉस सेटिंग्स जोखिम नियंत्रण के लिए अनुकूल हैं
जोखिम विश्लेषण
- सूचकांक में कुछ हद तक पीछे हटने से रणनीति खराब हो सकती है
- केवल एक सूचकांक के आधार पर गलत संकेत
- स्टॉप लॉस सेटिंग्स के लिए अनुकूलन के लिए जगह है, जो ओवरस्टॉप हो सकता है
अनुकूलन दिशा
- अन्य संकेतकों जैसे कि ब्रिन बैंड, आरएसआई आदि के साथ व्यापार संकेतों को फ़िल्टर करने पर विचार करें
- विभिन्न सूचक पैरामीटर सेटिंग्स का परीक्षण करें
- परीक्षण और क्षति रोकथाम के लिए अनुकूलन
- विभिन्न किस्मों और चक्रों के लिए अधिक परीक्षण डेटा
संक्षेप
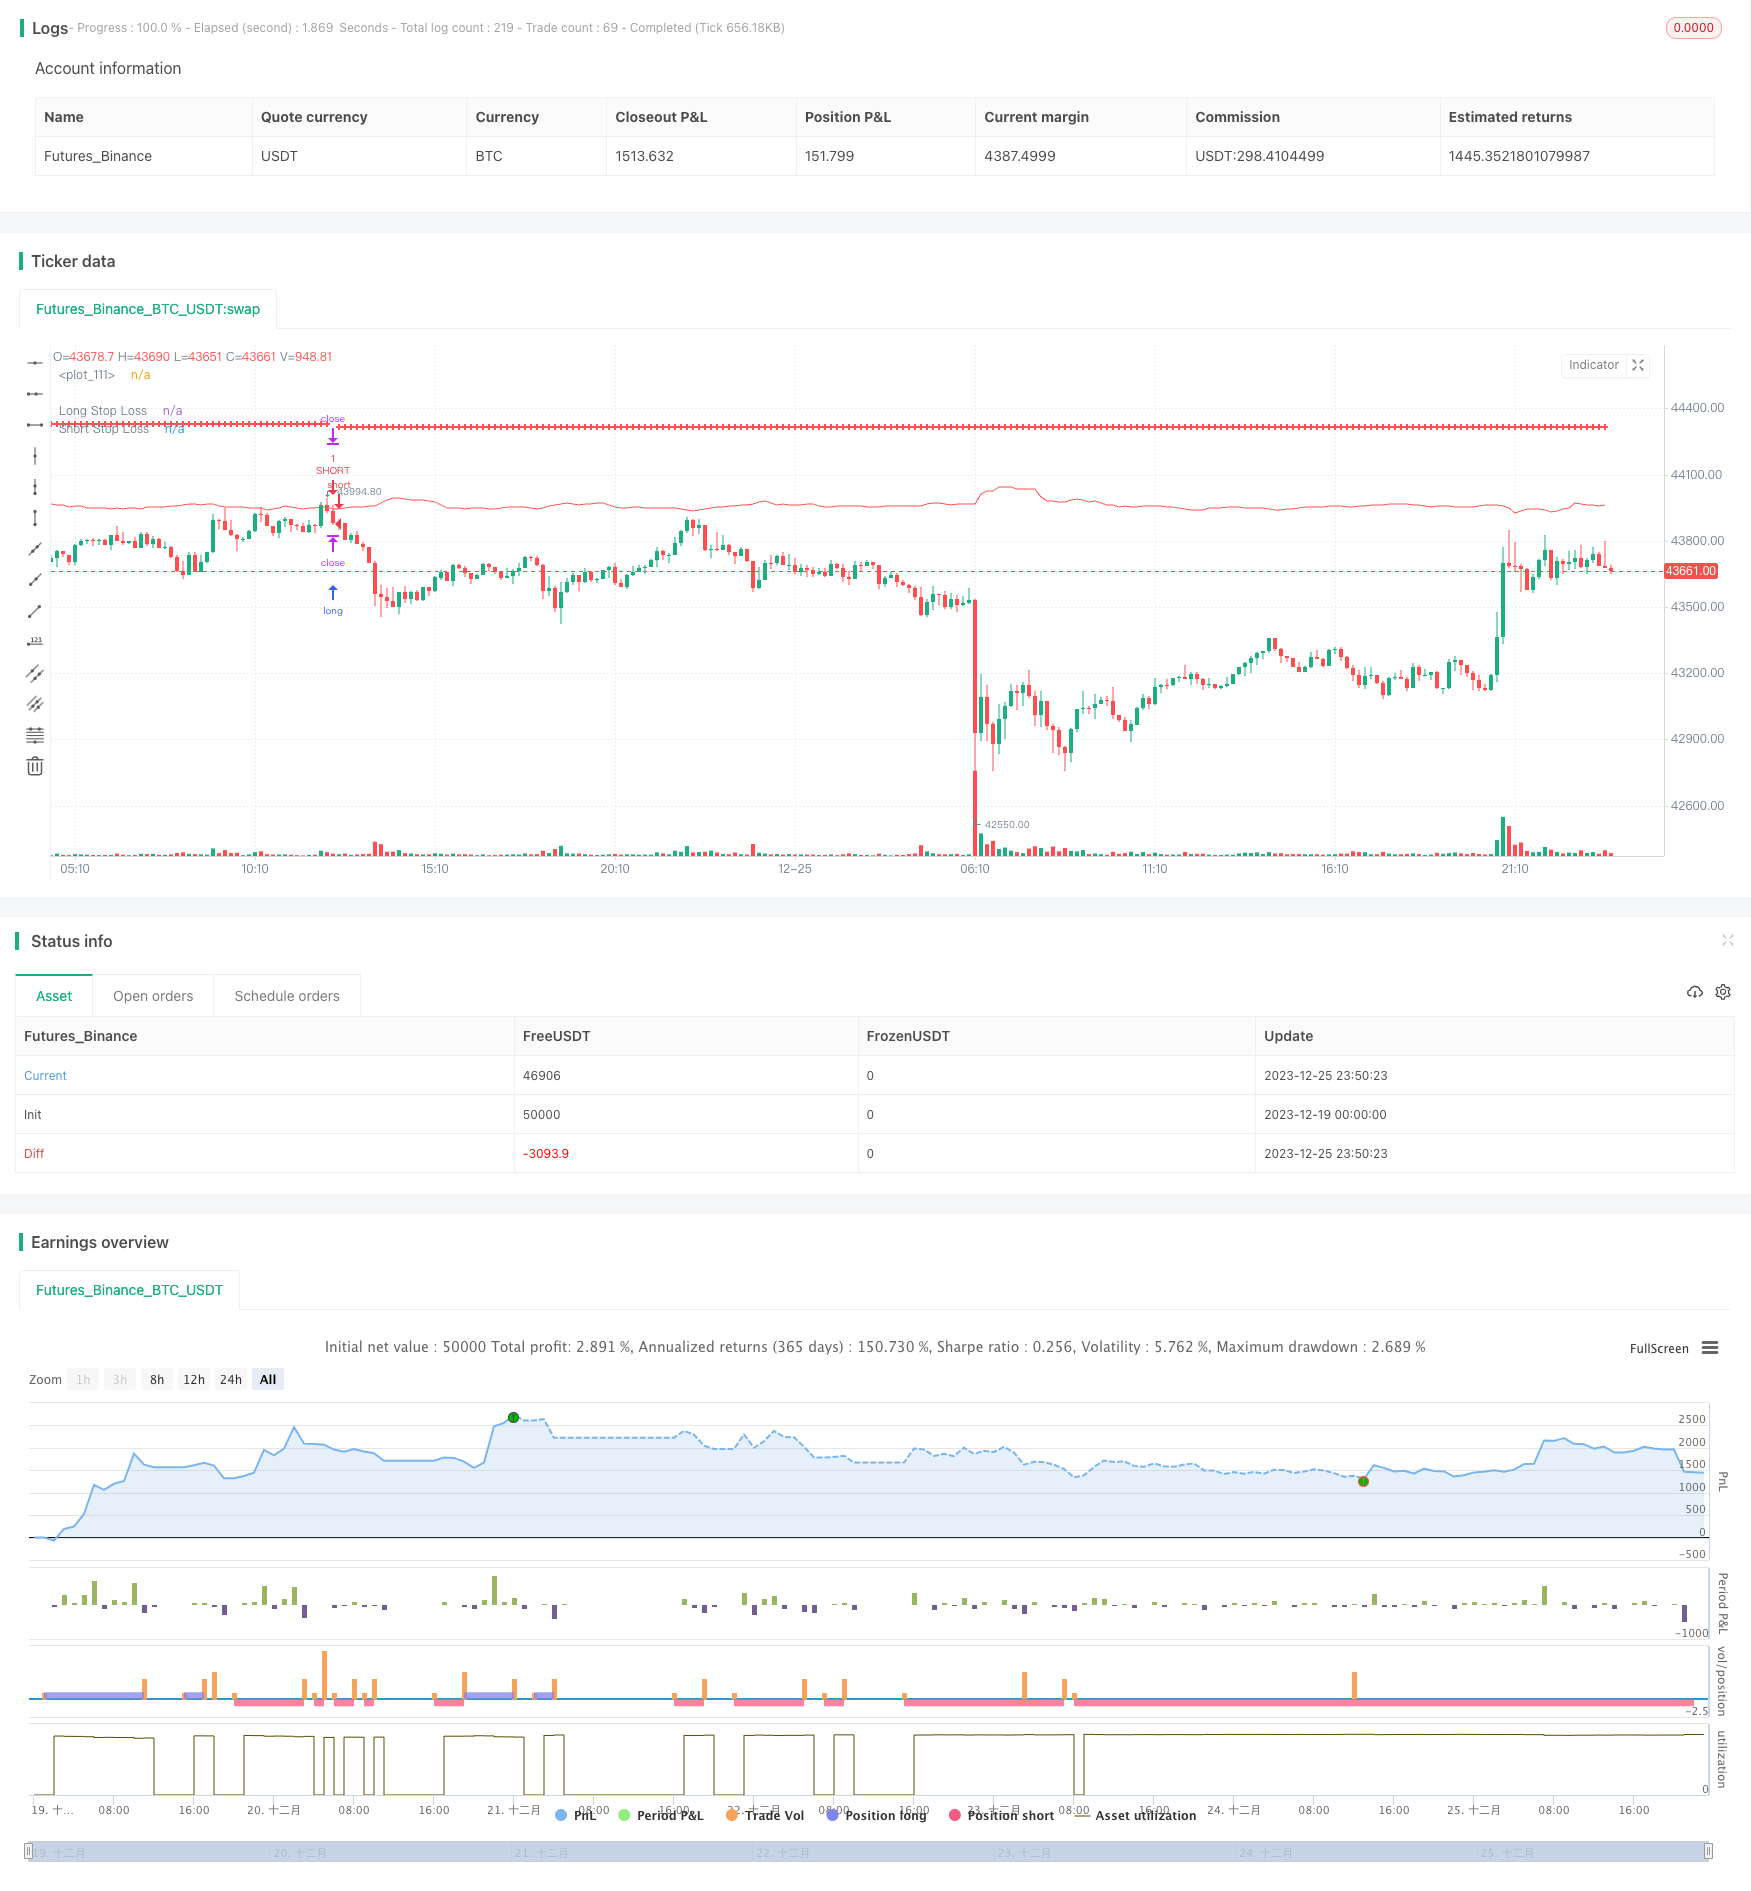
इस रणनीति की समग्र सोच स्पष्ट है, कस्टम संकेतक का उपयोग कर प्रवृत्ति की पहचान करें और प्रवृत्ति को ट्रैक करने के तरीके से व्यापार करें। रिट्रेसमेंट परिणामों के अनुसार, रणनीति अच्छा प्रदर्शन करती है, इसमें कुछ वास्तविक डिस्क उपयोग क्षमता है। लेकिन केवल एक संकेतक पर निर्भर है और कुछ रिट्रेसमेंट है, सिग्नल गुणवत्ता अभी भी सत्यापित करने की आवश्यकता है। इसके अलावा, स्टॉप-लॉस तंत्र को और परीक्षण और अनुकूलन की आवश्यकता है। कुल मिलाकर, रणनीति की अवधारणा व्यवहार्य है, लेकिन अभी भी वास्तविक डिस्क उपयोगिता को बढ़ाने के लिए अधिक काम करने की आवश्यकता है।
/*backtest
start: 2023-12-19 00:00:00
end: 2023-12-26 00:00:00
period: 10m
basePeriod: 1m
exchanges: [{"eid":"Futures_Binance","currency":"BTC_USDT"}]
*/

// This source code is subject to the terms of the Mozilla Public License 2.0 at https://mozilla.org/MPL/2.0/

// © TraderHalai
// This is a backtest of the Smoothed Heikin Ashi Trend indicator, which computes the reverse candle close price required to flip a heikin ashi trend from red to green and vice versa. Original indicator can be found on the scripts section of my profile.

// Default testing parameters are 10% of equity position size, with a 1% stop loss on short and long strategy.opentrades.commission

// This particular back test uses this indicator as a Trend trading tool with a tight stop loss. The equity curve as tested seems promising but requires further work to refine. Note in an actual trading setup, you may wish to use this with volatilty filters as most of the losses are in sideways, low volatility markets.


//@version=5
strategy("Smoothed Heikin Ashi Trend on Chart - TraderHalai BACKTEST", " SHA Trend - BACKTEST", overlay=true)
//Inputs

i_useSmooth =       input ( true, "Use smoothing Heikin Ashi")
i_smoothingMethod = input.string("SMA", "Method", options=["SMA", "EMA", "HMA", "VWMA", "RMA"])
i_smoothingPeriod = input ( 10, "Smoothing period")

i_infoBox   =       input ( true, "Show Info Box"        )
i_decimalP  =       input ( 2,    "Prices Decimal Places")
i_boxOffSet =       input ( 5,    "Info Box Offset"      )
i_repaint   =       input (false,  "Repaint -  Keep on for live / Off for backtest")

i_longLossPerc = input.float(title="Long Stop Loss (%)",minval=0.0, step=0.1, defval=1) * 0.01

i_shortLossPerc = input.float(title="Short Stop Loss (%)", minval=0.0, step=0.1, defval=1) * 0.01


timeperiod = timeframe.period

//Security functions to avoid repaint, as per PineCoders
f_secureSecurity(_symbol, _res, _src) => request.security(_symbol, _res, _src[1], lookahead = barmerge.lookahead_on)
f_security(_symbol, _res, _src, _repaint) => request.security(_symbol, _res, _src[_repaint ? 0 : barstate.isrealtime ? 1 : 0])[_repaint ? 0 : barstate.isrealtime ? 0 : 1]
f_secSecurity2(_symbol, _res, _src) => request.security(_symbol, _res, _src[1])


candleClose = f_security(syminfo.tickerid, timeperiod, close, i_repaint)
candleOpen = f_security(syminfo.tickerid, timeperiod, open, i_repaint)
candleLow = f_security(syminfo.tickerid, timeperiod, low, i_repaint)
candleHigh = f_security(syminfo.tickerid, timeperiod, high, i_repaint)

haTicker = ticker.heikinashi(syminfo.tickerid)
haClose = f_security(haTicker, timeperiod, close, i_repaint)
haOpen = f_security(haTicker, timeperiod, open, i_repaint)
haLow = f_security(haTicker, timeperiod, low, i_repaint)
haHigh= f_security(haTicker, timeperiod, high, i_repaint)


reverseClose = (2 * (haOpen[1] + haClose[1])) - candleHigh - candleLow - candleOpen

if(reverseClose < candleLow)
    reverseClose := (candleLow + reverseClose) / 2

if(reverseClose > candleHigh)
    reverseClose := (candleHigh + reverseClose) / 2

//Smoothing

smaSmoothed = ta.sma(reverseClose, i_smoothingPeriod)
emaSmoothed = ta.ema(reverseClose, i_smoothingPeriod)
hmaSmoothed = ta.hma(reverseClose, i_smoothingPeriod)
vwmaSmoothed = ta.vwma(reverseClose, i_smoothingPeriod)
rmaSmoothed = ta.rma(reverseClose, i_smoothingPeriod)

shouldApplySmoothing = i_useSmooth and i_smoothingPeriod > 1

smoothedReverseClose = reverseClose

if(shouldApplySmoothing)
    if(i_smoothingMethod == "SMA")
        smoothedReverseClose := smaSmoothed
    else if(i_smoothingMethod == "EMA")
        smoothedReverseClose := emaSmoothed
    else if(i_smoothingMethod == "HMA")
        smoothedReverseClose := hmaSmoothed
    else if(i_smoothingMethod == "VWMA")
        smoothedReverseClose := vwmaSmoothed
    else if(i_smoothingMethod == "RMA")
        smoothedReverseClose := rmaSmoothed
    else
        smoothedReverseClose := reverseClose // Default to non-smoothed for invalid smoothing type

haBull = candleClose >= smoothedReverseClose
haCol = haBull ? color.green : color.red


//Overall trading strategy
if(ta.crossover(candleClose, smoothedReverseClose))
    strategy.entry("LONG", strategy.long, stop=smoothedReverseClose)
else
    strategy.cancel("LONG")

if(ta.crossunder(candleClose, smoothedReverseClose))
    strategy.entry("SHORT", strategy.short, stop=smoothedReverseClose)
else
    strategy.cancel("SHORT")


longStopPrice  = strategy.position_avg_price * (1 - i_longLossPerc)
shortStopPrice = strategy.position_avg_price * (1 + i_shortLossPerc)


plot(series=(strategy.position_size > 0) ? longStopPrice : na,
     color=color.red, style=plot.style_cross,
     linewidth=2, title="Long Stop Loss")
plot(series=(strategy.position_size < 0) ? shortStopPrice : na,
     color=color.red, style=plot.style_cross,
     linewidth=2, title="Short Stop Loss")

plot(smoothedReverseClose, color=haCol)

if (strategy.position_size > 0)
    strategy.exit(id="XL STP", stop=longStopPrice)

if (strategy.position_size < 0)
    strategy.exit(id="XS STP", stop=shortStopPrice)