अनेक संकेतकों पर आधारित प्रवृत्ति-अनुसरण रणनीतियाँ
अवलोकन
इस नीति का नाम हैबहु-सूचक संयोजन ट्रेंड ट्रैकिंग रणनीति(Multi-Indicator Trend Tracking Strategy), जो फिशर परिवर्तित संकेतक, भारित चलती औसत (WMA), अपेक्षाकृत मजबूत संकेतक (RSI) और औसत रेखा (OBV) जैसे कई संकेतकों का उपयोग करके बाजार की प्रवृत्ति की दिशा का आकलन करता है, प्रवृत्ति ट्रैकिंग ट्रेडों को लागू करता है।
रणनीति सिद्धांत
- फिशर परिवर्तन सूचक मूल्य परिवर्तन की प्रवृत्ति और ताकत का आकलन करता है। जब चार फिशर लाइनें एक साथ बदलती हैं तो यह एक व्यापार संकेत देता है।
- डब्ल्यूएमए ने दिशानिर्देशों की दिशा निर्धारित की। आरएसआई ने गलत संकेतों को फ़िल्टर किया।
- OBV का उपयोग प्रवृत्ति की पुष्टि करने के लिए किया जाता है।
विशेष रूप से, फिशर रूपांतरण सूचक में 1 गुना, 2 गुना, 4 गुना और 8 गुना 4 लाइनें होती हैं। जब 4 लाइनें एक साथ ऊपर की ओर हरे रंग की होती हैं, तो एक बहुसंकेत उत्पन्न होता है, और 4 लाइनें एक साथ नीचे की ओर लाल रंग की होती हैं, तो एक शून्य संकेत उत्पन्न होता है। डब्ल्यूएमए एक बड़ी प्रवृत्ति की दिशा का फैसला करता है, यदि सूचक ऊपर की ओर है, तो इसे पूर्वाग्रह के रूप में माना जाता है, और नीचे की ओर एक पूर्वाग्रह के रूप में माना जाता है। ओबीवी प्रवृत्ति की दिशा की पुष्टि करने के लिए उपयोग किया जाता है।
श्रेष्ठता विश्लेषण
इस रणनीति के निम्नलिखित फायदे हैं:
- फिशर परिवर्तन सूचकांक में एक मजबूत निर्णय क्षमता है, जब चार फिशर लाइनें एक साथ रंग बदलती हैं, तो यह सुनिश्चित करने के लिए कि प्रवृत्ति में बदलाव की संभावना बहुत अधिक है।
- डब्ल्यूएमए प्रमुख रुझानों की दिशा का आकलन करता है और विपरीत ट्रेडिंग से बचता है।
- OBV संकेतक प्रवृत्ति की पुष्टि करता है और ट्रेंडलेस बाजारों में झूठे ब्रेक से बचाता है।
- आरएसआई संकेतकों की विश्वसनीयता सुनिश्चित करने के लिए झूठे संकेतों को फ़िल्टर करता है
कई संकेतकों के संयोजन के माध्यम से, ट्रेडिंग सिग्नल की सटीकता और विश्वसनीयता सुनिश्चित करने के साथ-साथ रुझानों का पालन करने की क्षमता के साथ, बेहतर रणनीतिक प्रभाव प्राप्त किया जा सकता है।
जोखिम विश्लेषण
इस रणनीति में कुछ जोखिम भी हैं:
- यदि बाजार में कोई सुधार होता है, तो फिशर लाइन झूठे संकेतों के लिए अतिसंवेदनशील होती है। इस स्थिति में, RSI फ़िल्टर पर भरोसा करना आवश्यक है।
- WMA पैरामीटर की गलत सेटिंग भी निर्णय accurancy को प्रभावित कर सकती है.
- फिशर परिवर्तन सूचकांक सुपर शॉर्ट लाइन के बारे में खराब है।
- यदि कोई व्यक्ति किसी भी तरह से अपनी संपत्ति का उपयोग कर सकता है, तो उसे अपने जीवन में बहुत अधिक जोखिम उठाने की आवश्यकता है।
जोखिम को कम करने के लिए, आरएसआई पैरामीटर को उचित रूप से समायोजित किया जा सकता है, डब्ल्यूएमए चक्र पैरामीटर को अनुकूलित किया जा सकता है। साथ ही, स्टॉप लॉस पॉइंट सेट किया जा सकता है, जिससे भारी नुकसान से बचा जा सकता है।
अनुकूलन दिशा
इस रणनीति को और भी बेहतर बनाया जा सकता है:
- विभिन्न आवधिक मापदंडों के तहत रणनीति के प्रभाव का परीक्षण करने के लिए, सबसे अच्छा पैरामीटर संयोजन ढूंढें।
- अतिरिक्त रोकथाम तंत्र. जब नुकसान एक निश्चित अनुपात तक पहुंच जाता है तो रोकथाम।
- फिशर परिवर्तन सूचकांक के मापदंडों को पुनः माप के परिणामों के आधार पर और अधिक समायोजित किया गया है ताकि सूचकांक के लिए सबसे सटीक मापदंडों का संयोजन पाया जा सके।
- अन्य संकेतकों के लिए फ़िल्टर जोड़ने का प्रयास करें, जैसे कि मजबूत, कमजोर, पक्षपाती आदि।
- विभिन्न आकारों की जांच करें।
संक्षेप
इस रणनीति में फिशर परिवर्तन सूचक, डब्ल्यूएमए सूचक, ओबीवी सूचक और आरएसआई सूचक का व्यापक उपयोग किया गया है, ताकि बाजार की प्रवृत्ति दिशा का आकलन किया जा सके। इसका आकलन सिग्नल सटीक है, इसकी पुष्टि करने की क्षमता मजबूत है, और यह प्रभावी रूप से प्रवृत्ति को लाभदायक बनाने में सक्षम है। पैरामीटर के अनुकूलन के माध्यम से, रणनीति के लाभ कारक को और बढ़ाया जा सकता है। कुल मिलाकर, इस रणनीति ने संकेतक के संयोजन के आधार पर निर्णय लिया है।
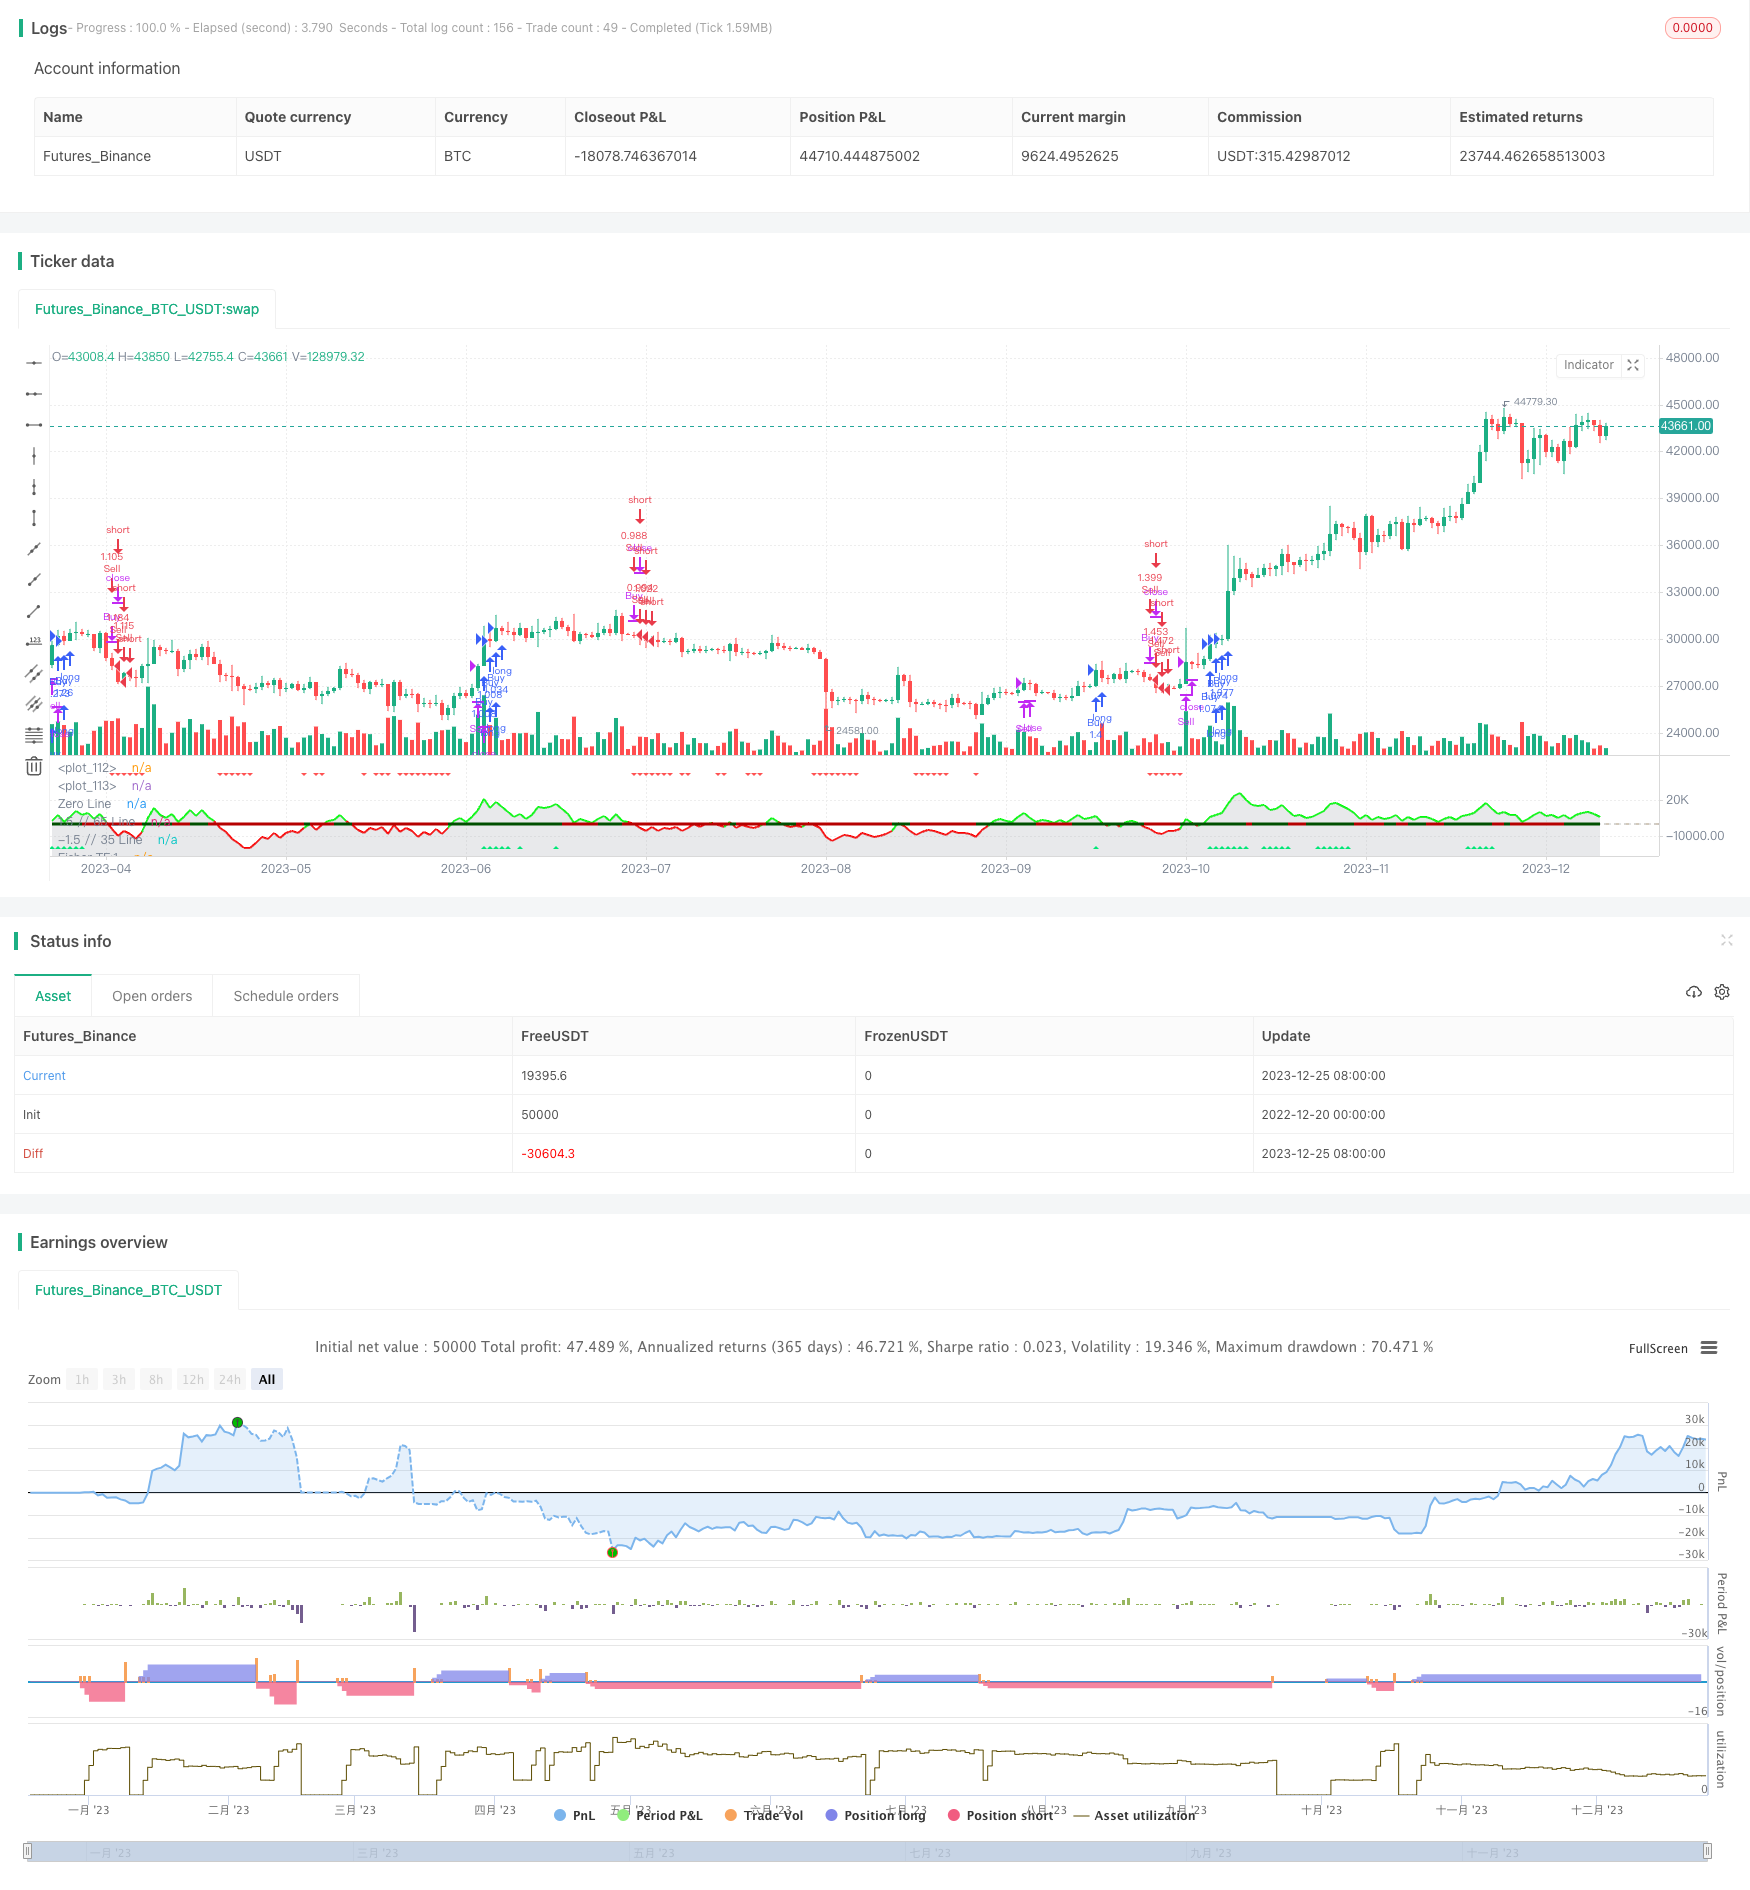
/*backtest
start: 2022-12-20 00:00:00
end: 2023-12-26 00:00:00
period: 1d
basePeriod: 1h
exchanges: [{"eid":"Futures_Binance","currency":"BTC_USDT"}]
*/

//@version=5
//author Sdover0123
strategy(title='FTR, WMA, OBV & RSI Strat', shorttitle='FTR WMA, OBV, RSI',overlay=false, default_qty_type=strategy.percent_of_equity, initial_capital = 100, default_qty_value=100, commission_value = 0.06, pyramiding = 3)
Len = input.int(10, minval=1, group ="Fisher Transform")
mult1 = input.int(1, minval=1, group ="Fisher Transform")
mult2 = input.int(2, minval=1, group ="Fisher Transform")
mult3 = input.int(4, minval=1, group ="Fisher Transform")
mult4 = input.int(8, minval=1, group ="Fisher Transform")
fish(Length, timeMultiplier) =>
    var nValue1 = 0.0
    var nValue2 = 0.0
    var nFish = 0.0
    xHL2 = hl2
    xMaxH = ta.highest(xHL2, Length * timeMultiplier)
    xMinL = ta.lowest(xHL2, Length * timeMultiplier)
    nValue1 := 0.33 * 2 * ((xHL2 - xMinL) / (xMaxH - xMinL) - 0.5) + 0.67 * nz(nValue1[1])
    if nValue1 > .99
        nValue2 := .999
        nValue2
    else if nValue1 < -.99
        nValue2 := -.999
        nValue2
    else
        nValue2 := nValue1
        nValue2
    nFish := 0.5 * math.log((1 + nValue2) / (1 - nValue2)) + 0.5 * nz(nFish[1])
    nFish
Fisher1 = fish(Len, mult1)
Fisher2 = fish(Len, mult2)
Fisher4 = fish(Len, mult3)
Fisher8 = fish(Len, mult4)

rsiLength = input.int(14, minval=1, group ="Moving Averages")
rsiVal = (ta.rsi(close, rsiLength) - 50) / 10
avg = strategy.position_avg_price

wma(source, length) =>
    sum = 0.0
    for i = 0 to length - 1
        sum := sum + source[i] * (length - i)
    wma = sum / (length * (length + 1) / 2)
    wma

wmaLength = input.int(10, "WMA Length", minval=1, group ="Moving Averages")
wmaClose = wma(close, wmaLength)
// Determine if WMA is bullish or bearish
isWmaBullish = wmaClose > wmaClose[1]
isWmaBearish = wmaClose < wmaClose[1]

//OBV
src = close
length = input.int(20, title="OBV Length", group="On-Balance Volume")
obv1(src) =>
    change_1 = ta.change(src)
    ta.cum(ta.change(src) > 0 ? volume : change_1 < 0 ? -volume : 0 * volume)*0.01
os = obv1(src)
obv_osc = os - ta.ema(os, length)
obc_color = (obv_osc > 0 ? color.rgb(0, 255, 8) : color.rgb(255, 0, 0))
plot(obv_osc, color=obc_color, style=plot.style_line, title='OBV-Points', linewidth=2)
plot(obv_osc, color=color.new(#b2b5be, 70), title='OBV', style=plot.style_area)
obvBullFilter = input.float(0.1, minval = 0, maxval = 5, step = 0.01, title ="OBV Bullish minimum value", group="On-Balance Volume")
obvBearFilter = input.float(-0.1, minval = -5, maxval = 0, step = 0.01, title ="OBV Bearish minimum value", group="On-Balance Volume")
obvBull = obv_osc > obvBullFilter
obvBear = obv_osc < obvBearFilter

// Add buy/sell signals
ReversalFilterDown = input.float(-0.7, 'Reversal Down TP Filter', -4, 4, step = 0.01, group = "RSI Level Filters", tooltip = "This is defined by taking the RSI value -50 and /10. When all Fisher lines are changing colour, this will SL/TP the long")
ReversalFilterUp = input.float(0.7, 'Reversal Up TP Filter', -4, 4, step = 0.01, group = "RSI Level Filters", tooltip = "This is defined by taking the RSI value -50 and /10. When all Fisher lines are changing colour, this will SL/TP the short")
RSILevelBuyFilter = input.float(1.66, 'RSI Level Buy Filter', -4, 4, step = 0.01, group = "RSI Level Filters", tooltip = "This is defined by taking the RSI value -50 and /10. Consider negative values")
RSILevelSellFilter = input.float(1, 'RSI Level Sell Filter', -4, 4, step = 0.01, group = "RSI Level Filters", tooltip = "This is defined by taking the RSI value -50 and /10. Consider negative values")
//buys - if breaking out and all Fisher are green and RSI filter value is met
buySignal = Fisher1 > Fisher1[1] and Fisher2 > Fisher2[1] and Fisher4 > Fisher4[1] and Fisher8 > Fisher8[1] and rsiVal > RSILevelBuyFilter and isWmaBullish and obvBull
ReversalUp = Fisher1 > Fisher1[1] and Fisher2 > Fisher2[1] and Fisher4 > Fisher4[1] and Fisher8 > Fisher8[1] and rsiVal > ReversalFilterUp
//sells - if breaking down and all Fisher are green and RSI filter value is met
sellSignal = Fisher1 < Fisher1[1] and Fisher2 < Fisher2[1] and Fisher4 < Fisher4[1] and Fisher8 < Fisher8[1] and rsiVal < RSILevelSellFilter and isWmaBearish and obvBear
ReversalDown = Fisher1 < Fisher1[1] and Fisher2 < Fisher2[1] and Fisher4 < Fisher4[1] and Fisher8 < Fisher8[1] and rsiVal < ReversalFilterDown


// Buy and Sell conditions
if buySignal and time>timestamp(2022, 06, 01, 09, 30) and barstate.isconfirmed
    strategy.close("Sell", comment = "Close Short")
    strategy.entry("Buy", strategy.long, comment = "Long")

if sellSignal and time>timestamp(2022, 06, 01, 09, 30) and barstate.isconfirmed
    strategy.close("Buy", comment = "Close Long")
    strategy.entry("Sell", strategy.short, comment = "Short")

if ReversalDown
    strategy.close("Buy", comment = "Close Long")

if ReversalUp
    strategy.close("Sell", comment = "Close Short")

//Plotting
//Fisher
plot(Fisher1, color=Fisher1 > nz(Fisher1[1]) ? color.green : color.rgb(255, 0, 0), title='Fisher TF:1')
plot(Fisher2, color=Fisher2 > nz(Fisher2[1]) ? color.green : color.rgb(255, 0, 0), title='Fisher TF:1', linewidth=2)
plot(Fisher4, color=Fisher4 > nz(Fisher4[1]) ? #008000 : #b60000, title='Fisher TF:1', linewidth=3)
plot(Fisher8, color=Fisher8 > nz(Fisher8[1]) ? #004f00 : #b60000, title='Fisher TF:1', linewidth=3)
//RSI
plot(rsiVal, color=rsiVal < 0 ? color.purple : color.yellow, linewidth=2, title='RSI')

//WMA
plot(isWmaBullish ? -2 : na, color=color.rgb(76, 175, 79, 20), linewidth=3, style=plot.style_linebr, title="WMA Bullish")
plot(isWmaBearish ? -2 : na, color=color.rgb(255, 82, 82, 20), linewidth=3, style=plot.style_linebr, title="WMA Bearish")

//Buy/Sell Signals
plotshape(buySignal, title='Buy Signal', location=location.bottom, color=color.new(color.lime, 0), style=shape.triangleup, size=size.small)
plotshape(sellSignal, title='Sell Signal', location=location.top, color=color.new(color.red, 0), style=shape.triangledown, size=size.small)

//Orientation
hline(RSILevelBuyFilter, color=color.rgb(25, 36, 99, 20), linestyle=hline.style_dotted, linewidth=2)
hline(RSILevelSellFilter, color=color.rgb(111, 27, 27, 20), linestyle=hline.style_dotted, linewidth=2)
hline(0, color=color.rgb(181, 166, 144, 39), linestyle=hline.style_dashed, linewidth=2, title = "Zero Line")
hline(1.5, color=color.rgb(217, 219, 220, 50), linestyle=hline.style_dotted, linewidth=2, title = "1.5 // 65 Line")
hline(-1.5, color=color.rgb(217, 219, 220, 50), linestyle=hline.style_dotted, linewidth=2, title = "-1.5 // 35 Line")