धीमी आरएसआई ओवरबॉट और ओवरसोल्ड रणनीति
अवलोकन
धीमी आरएसआई ओवरबॉय ओवरसोल रणनीति आरएसआई के पुनरावलोकन चक्र को लम्बा करके आरएसआई वक्र की अस्थिरता को कम करती है, जिससे व्यापार के नए अवसर खुलते हैं। यह रणनीति अन्य तकनीकी संकेतकों जैसे एमएसीडी के लिए भी लागू होती है।
रणनीति सिद्धांत
इस रणनीति का मुख्य विचार आरएसआई के रिव्यू चक्र की लंबाई को बढ़ाने के लिए है, डिफ़ॉल्ट रूप से 500 चक्र, और फिर एसएमए के माध्यम से आरएसआई वक्र को चिकना करने के लिए, डिफ़ॉल्ट चक्र 250 है। इससे आरएसआई वक्र की अस्थिरता को काफी कम किया जा सकता है, आरएसआई की प्रतिक्रिया की गति को धीमा किया जा सकता है, जिससे नए व्यापार के अवसर पैदा होते हैं।
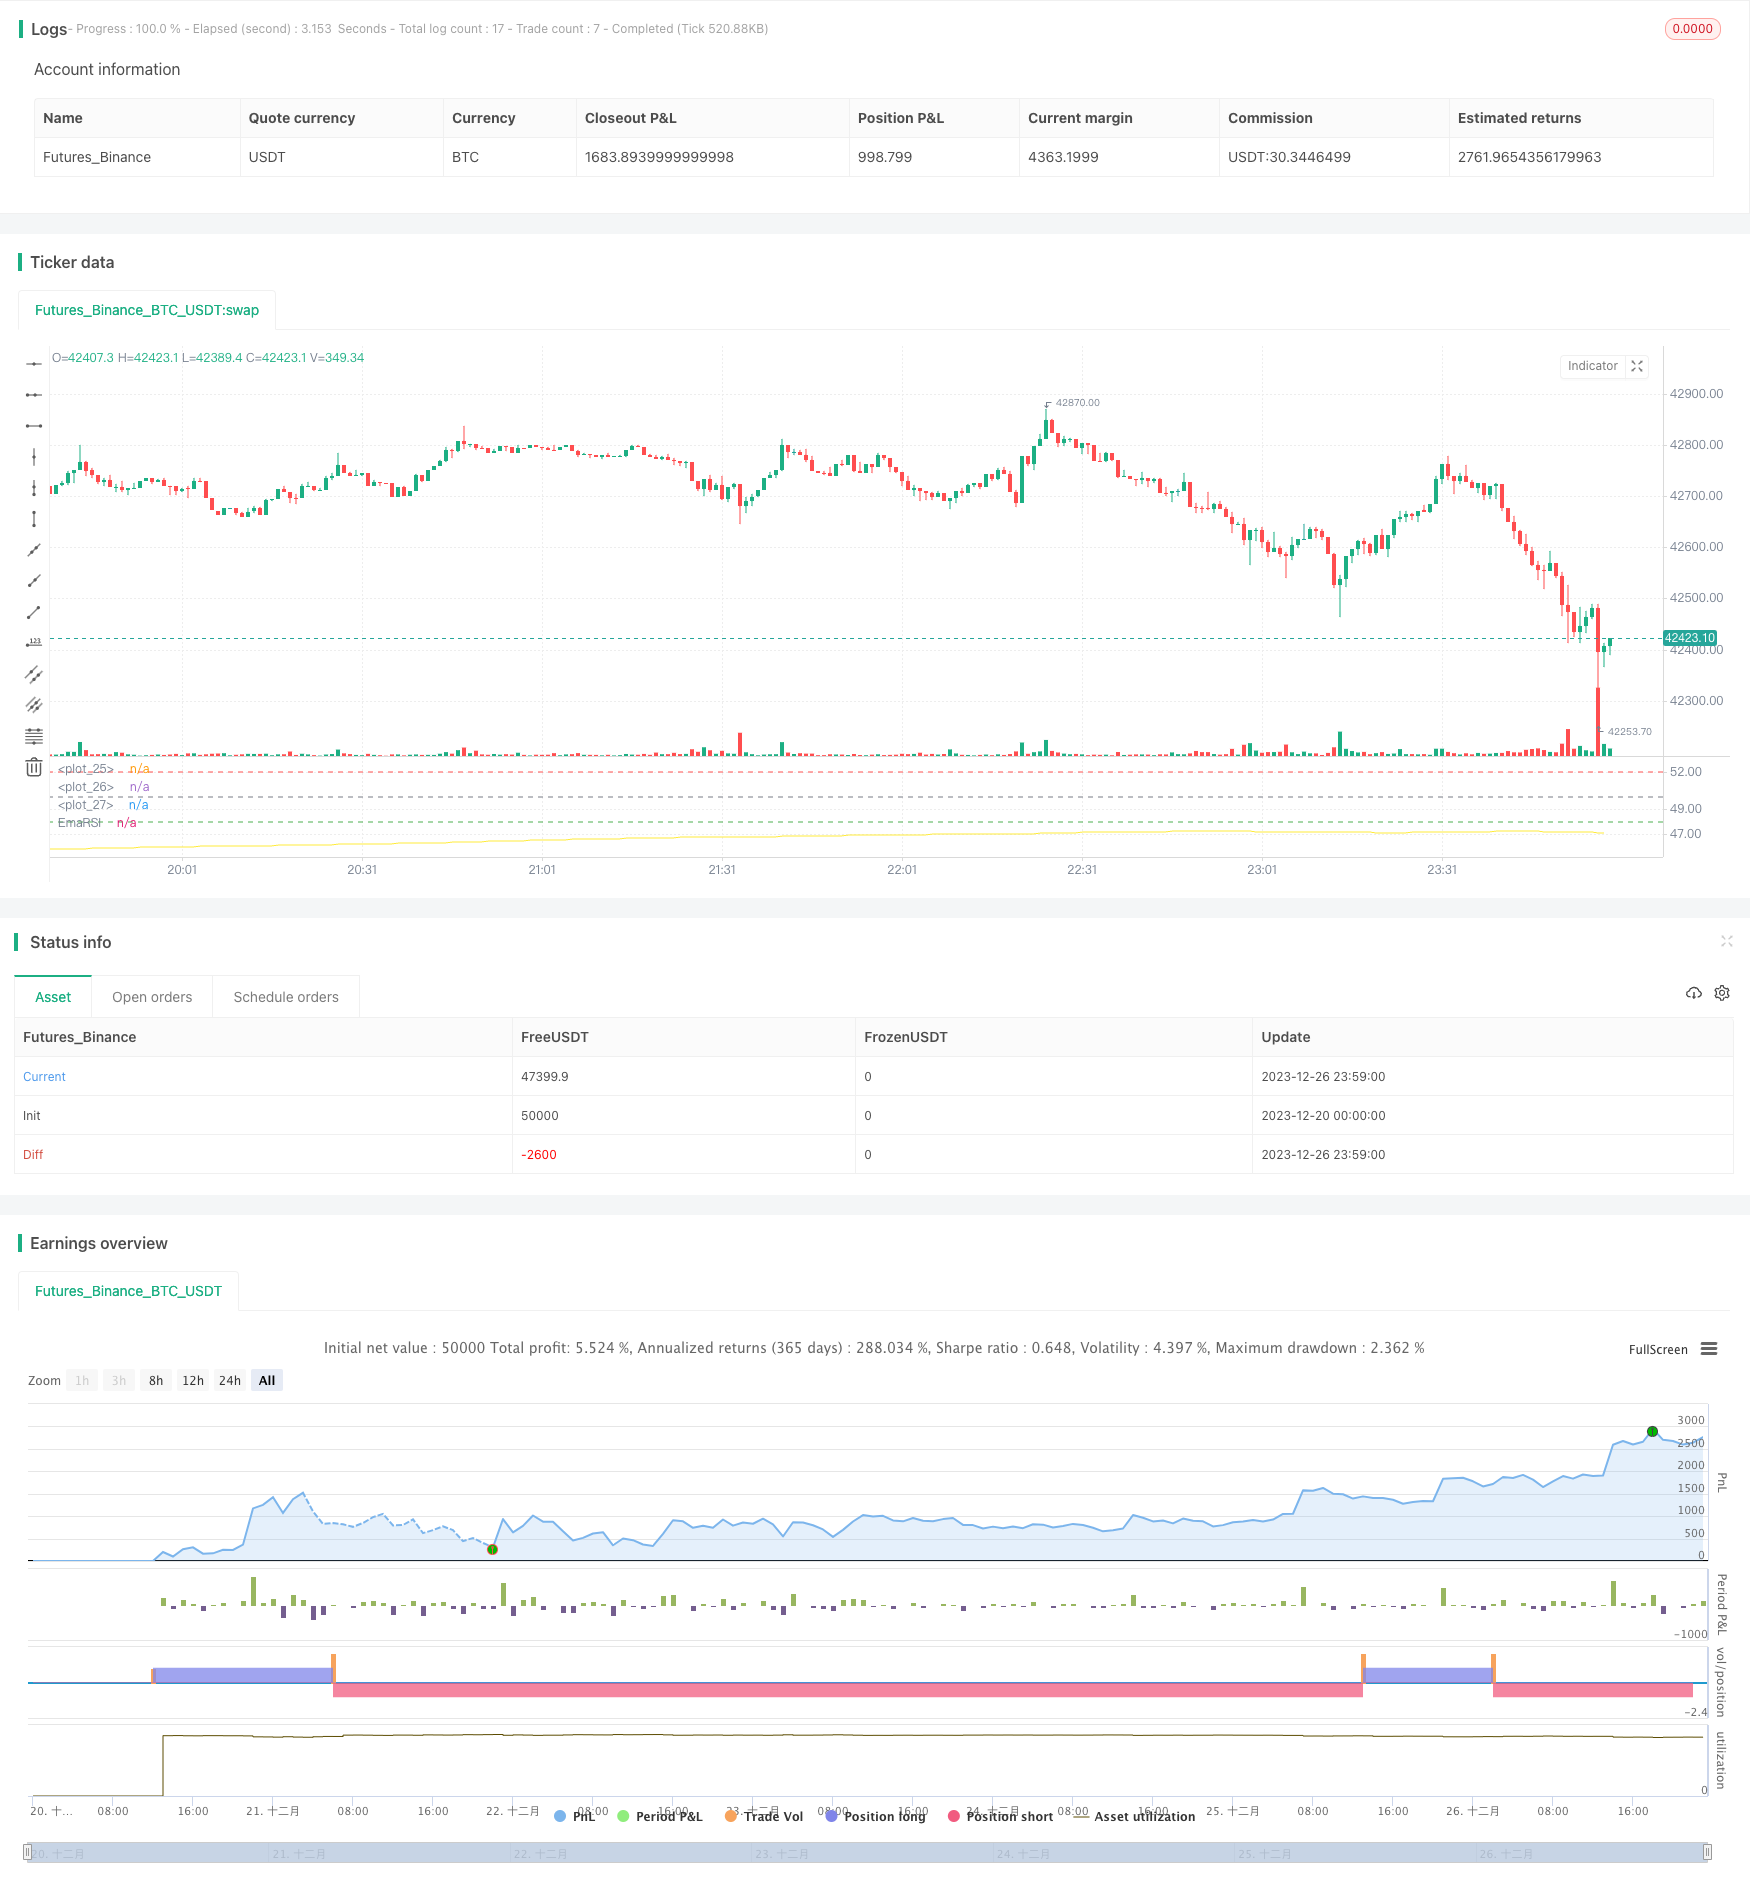
बहुत लंबे समय तक रिव्यू चक्र ने आरएसआई वक्र की अस्थिरता को कम कर दिया है, इसलिए ओवरबॉय और ओवरसोल के लिए मानदंडों को भी समायोजित करने की आवश्यकता है। रणनीति ने कस्टम ओवरबॉय लाइन 52 और ओवरसोल लाइन 48 की स्थापना की है। जब भारित आरएसआई ओवरसोल लाइन को नीचे से तोड़ता है तो एक अधिक संकेत उत्पन्न होता है; जब यह ओवरबॉय लाइन को ऊपर से तोड़ता है तो एक कम संकेत उत्पन्न होता है।
रणनीतिक लाभ
- नवाचारशीलता, लंबी अवधि के माध्यम से नए व्यापारिक विचारों को खोलना
- यह बहुत कम झूठे संकेतों और स्थिरता को बढ़ाता है।
- अनुकूलन योग्य ओवरबॉट ओवरसोल्ड थ्रेशोल्ड, विभिन्न बाजारों के लिए अनुकूलित
- बीज बोया जा सकता है, रिटर्न बढ़ाया जा सकता है
रणनीतिक जोखिम
- लंबे समय तक चलने वाले चक्रों से शॉर्ट-लाइन के अवसरों को चूकना
- धैर्य के साथ प्रतीक्षा करें
- ओवरबॉय और ओवरसेलिंगः गलत मूल्य सीमा सेटिंग से नुकसान बढ़ सकता है
- जुए का जोखिम
समाधान:
- उचित रूप से चक्र को छोटा करना और लेनदेन की आवृत्ति को बढ़ाना
- जोखिमों को अलग-अलग करने के लिए स्टोरेज का निर्माण
- विभिन्न बाजार स्थितियों के लिए मूल्यह्रास पैरामीटर का अनुकूलन
- स्टॉपलॉस सेट करें और बड़े नुकसान से बचें
रणनीति अनुकूलन दिशा
- आरएसआई के पैरामीटर को अनुकूलित करें और सबसे अच्छा चक्र संयोजन खोजें
- विभिन्न SMA चिकनाई चक्र मापदंडों का परीक्षण
- विभिन्न बाजारों के लिए ओवरबॉय और ओवरसेलिंग पैरामीटर का अनुकूलन
- स्टॉप लॉस रणनीति जोड़ें, एकल नुकसान को नियंत्रित करें
संक्षेप
धीमी गति से आरएसआई ओवरबाय ओवरसोल रणनीति ने चक्र को लम्बा करने और औसत रेखा को कम करने के तरीके का उपयोग करके नए व्यापारिक विचारों को सफलतापूर्वक खोला। इस रणनीति को पैरामीटर अनुकूलन और जोखिम नियंत्रण के साथ स्थिर और कुशल अतिरिक्त लाभ प्राप्त करने की उम्मीद है। कुल मिलाकर, इस रणनीति में बहुत मजबूत नवीनता और व्यावहारिक मूल्य है।
/*backtest
start: 2023-12-20 00:00:00
end: 2023-12-27 00:00:00
period: 1m
basePeriod: 1m
exchanges: [{"eid":"Futures_Binance","currency":"BTC_USDT"}]
*/


// Wilder was a very influential man when it comes to TA. However, I'm one to always try to think outside the box.
// While Wilder recommended that the RSI be used only with a 14 bar lookback period, I on the other hand think there is a lot to learn from RSI if one simply slows down the lookback period
// Same applies for MACD.
// Every market has its dynmaics. So don't narrow your mind by thinking my source code input levels are the only levels that work.
// Since the long lookback period weakens the plot volatility, again, one must think outside the box when trying to guage overbought and oversold levels.

// Good luck and don't bash me if some off-the-wall FA spurned divergence causes you to lose money.
// And NO this doesn't repaint and I won't answer those who ask.
//@version=4

strategy("SLOW RSI OB/OS Strategy", overlay=false)
price = input(ohlc4, title="Price Source")
len = input(500, minval=1, step=5,  title="RSI Length")
smoother = input(250, minval=1, step=5, title="RSI SMA")
up = rma(max(change(price), 0), len)
down = rma(-min(change(price), 0), len)
rsi = down == 0 ? 100 : up == 0 ? 0 : 100 - (100 / (1 + up / down))
EmaRSI = ema(rsi,smoother)
plot(EmaRSI, title="EmaRSI", style=line, linewidth=1, color=yellow)


OB = input(52, step=0.1)
OS = input(48, step=0.1)
hline(OB, linewidth=1, color=red)
hline(OS,linewidth=1, color=green)
hline(50,linewidth=1, color=gray)


long = change(EmaRSI) > 0 and EmaRSI <= 50 and crossover(EmaRSI, OS)
short = change(EmaRSI) < 0 and EmaRSI >= 50 and crossunder(EmaRSI, OB)


strategy.entry("Long", strategy.long, when=long) //_signal or long) //or closeshort_signal)
strategy.entry("Short", strategy.short, when=short) //_signal or short) // or closelong_signal)

// If you want to try to play with exits you can activate these!

//closelong = crossunder(EmaRSI, 0) //or crossunder(EmaRSI, OS)
//closeshort = crossover(EmaRSI, 0) //or crossover(EmaRSI, OB)

//strategy.close("Long", when=closelong)
//strategy.close("Short", when=closeshort)