मोबाइल वेगास चैनल क्रॉसिंग रणनीति
निर्माण तिथि:
2024-01-02 10:53:06
अंत में संशोधित करें:
2024-01-02 10:53:06
कॉपी:
7
क्लिक्स:
1491
1
ध्यान केंद्रित करना
1750
समर्थक
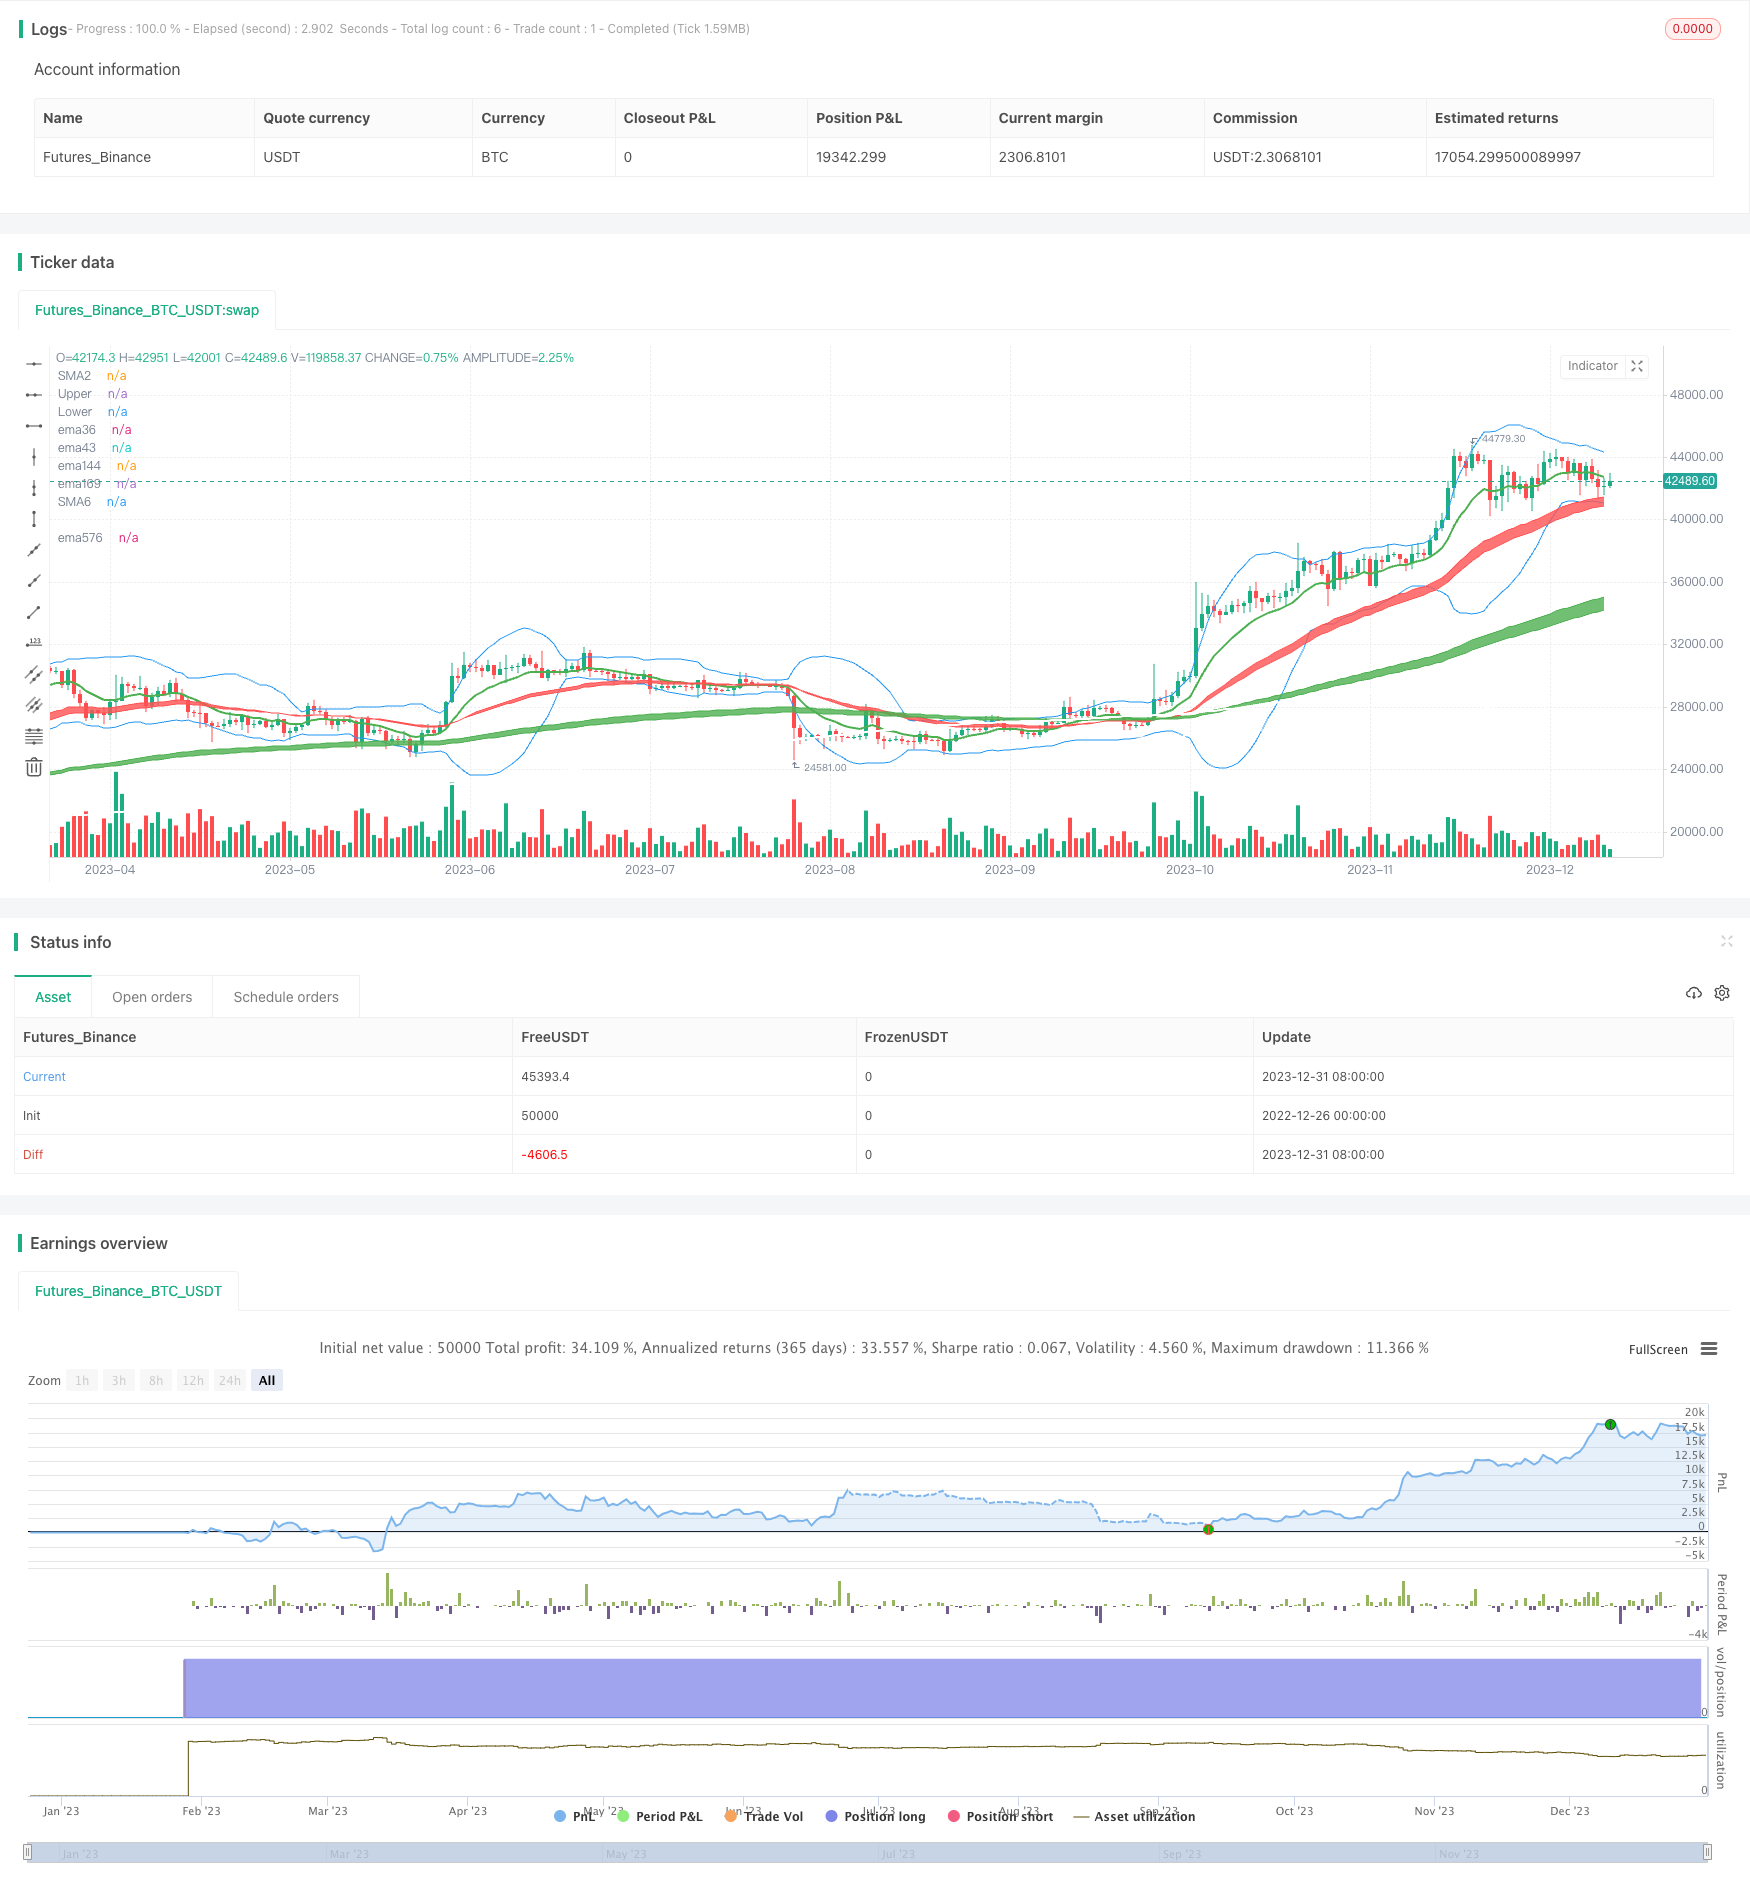
इस रणनीति का मुख्य विचार ईएमए 36,143,169 जैसे विभिन्न चक्रों की औसत रेखा के आधार पर शेयरों की अल्पकालिक और दीर्घकालिक प्रवृत्ति की दिशा का न्याय करना है, जो एमएसीडी सूचकांक के साथ मिलकर एक खरीद और बिक्री संकेत भेजता है। विशेष रूप से, अल्पकालिक ईएमए को 5,10 दिनों के ईएमए के साथ, मध्यम ईएमए को 20,60 दिनों के ईएमए के साथ, 120 और 250 दिनों के ईएमए को लंबे समय तक, जब अल्पकालिक ईएमए पर मध्य अवधि के ईएमए को पार करते हैं, तो अधिक देखें, नीचे देखें; एमएसीडी के बहुमुखी सूचकांक के साथ मिलकर खरीदने और बेचने का समय निर्धारित करें।
वेगास टनेल रणनीति के सिद्धांतः
- ईएमए 36 और ईएमए 43 का उपयोग अल्पकालिक रुझान के लिए किया जाता है, जो लाल चैनल बनाते हैं;
- ईएमए 144 और ईएमए 169 का उपयोग करके मध्यावधि प्रवृत्ति के लिए निर्णय लें, जो ग्रीन चैनल बनाते हैं;
- ईएमए 576 और ईएमए 676 का उपयोग दीर्घकालिक रुझान के लिए किया जाता है, जो ग्रे चैनल बनाते हैं;
- जब कीमतें ईएमए के समानांतर लाइन पर होती हैं, तो अधिक किया जा सकता है, और एमएसीडी संकेतक के साथ मिलकर 0 अक्ष को तोड़ने के लिए एक खरीद संकेत दिया जाता है;
- जब कीमतें ईएमए के माध्यम से गिरती हैं, तो यह एक शून्य संकेत देता है, जो एमएसीडी सूचकांक के साथ संयुक्त होता है।
- तीन ट्रेडिंग रणनीतियाँ हैं जो ईएमए की औसत अवधि के माध्यम से छोटी, मध्यम और लंबी हैं, जो अलग-अलग होल्डिंग पीरियड्स के अनुरूप हैं।
इस रणनीति के मुख्य लाभों में शामिल हैंः
- इस प्रकार, यह एक स्थिर प्रवृत्ति है, जिसमें तीन चैनल (लघु, मध्यम और लंबा) शामिल हैं।
- वेगास चैनल स्पष्ट और सहज है, और रुझानों का आकलन करना आसान है।
- MACD सूचकांक के साथ संयुक्त, यह एक अच्छा खरीद और बिक्री समय है।
- इस प्रकार, हम एक छोटे से तीन रणनीतियों का उपयोग कर सकते हैं, जिससे हम अधिक लचीलापन के साथ काम कर सकते हैं।
इस रणनीति के मुख्य जोखिम:
- जब शेयरों की कीमतों में भारी उतार-चढ़ाव होता है, तो ईएमए औसत में देरी होती है, जिससे गलत निर्णय लेने की संभावना अधिक होती है।
- तीनों चैनलों के बीच मतभेदों के कारण गलत कामकाज का खतरा है।
- समय के नक्शे को संचालित करने के लिए एक मजबूत मानसिक सहनशक्ति की आवश्यकता होती है।
कैसे करें:
- ईएमए की औसत अवधि को वर्तमान बाजार विशेषताओं के अनुरूप समायोजित किया जा सकता है।
- ट्रेड से पहले स्थिति अनुपात को समायोजित करें, एकल हानि को नियंत्रित करें।
इस रणनीति के अनुकूलन के लिए जगहः
- वेगास चैनल में प्रवृत्ति का निर्धारण करने के लिए पर्याप्त नहीं है, ब्यूरिन चैनल सहायक निर्णय को पेश किया जा सकता है।
- एमएसीडी सूचक केडी, आरएसआई और अन्य संकेतकों के साथ बदल सकता है।
- स्टॉप-लॉस रणनीतियों को बढ़ाएं, जैसे कि क्लोज-आउट की कीमतों में महत्वपूर्ण ईएमए से नीचे जाने पर सक्रिय स्टॉप-लॉस।
- A शेयरों में गिरावट का बड़ा प्रभाव, ETFs को कवर करने पर विचार करें.
रणनीति स्रोत कोड
/*backtest
start: 2022-12-26 00:00:00
end: 2024-01-01 00:00:00
period: 1d
basePeriod: 1h
exchanges: [{"eid":"Futures_Binance","currency":"BTC_USDT"}]
*/

//@version=4

strategy("Vegas Tunnel strategy", overlay=true)
//-------------------------------------------
//-------------------------------------------
// Inputs
useCurrentRes = input(true, title="Use Current Chart Resolution?")
resCustom = input(title="Use Different Timeframe? Uncheck Box Above", type=input.resolution, defval="D")
//tfSet = input(title = "Time Frame", options=["Current","120", "240", "D", "W"], defval="D")
tfSet = useCurrentRes ? timeframe.period : resCustom
maPeriods2 = input(12, "12 EMA")
maPeriods6 = input(240, "240 SMA")
BBlength = input(20, title="BB Length", minval=1)
BBsrc = input(close, title="BB Source")
mult = input(2.0, minval=0.001, maxval=50, title="BB StdDev")
sm2 = security(syminfo.tickerid, tfSet, ema(close, maPeriods2))
sm6 = security(syminfo.tickerid, tfSet, sma(close, maPeriods6))
p2 = plot(sm2, color=color.green, transp=30,  linewidth=2, title="SMA2")
p6 = plot(sm6, color=color.white, transp=30,  linewidth=2, title="SMA6")
//BB
basis = sma(BBsrc, BBlength)
dev = mult * stdev(BBsrc, BBlength)
upper = basis + dev
lower = basis - dev
offset = input(0, "BB Offset", type = input.integer, minval = -500, maxval = 500)
//plot(basis, "Basis", color=color.blue,linewidth, offset = offset)
pBB1 = plot(upper, "Upper", color=color.blue, offset = offset)
pBB2= plot(lower, "Lower", color=color.blue, offset = offset)

//MACD
fast_ma = ema(close, 48)
slow_ma = ema(close, 56)
macd = fast_ma - slow_ma

//vagas隧道
f1=ema(close, 36)
f2=ema(close, 43)
f3=ema(close, 144)
f4=ema(close, 169)
f5=ema(close, 576)
f6=ema(close, 676)
f7=ema(close,2304)
z1=plot(f1,color=color.red, title="ema36",transp=100)
z2=plot(f2,color=color.red, title="ema43",transp=100)
z3=plot(f3,color=color.green, title="ema144",transp=100)
z4=plot(f4,color=color.green, title="ema169",transp=100)
z5=plot(f5,color=color.white, title="ema576",transp=100)
z6=plot(f6,color=color.white, title="ema676",transp=100)
fill(z1, z2, color=color.red,transp=60)
fill(z3, z4, color=color.green,transp=60)
fill(z5, z6, color=color.gray,transp=60)

// Make input options that configure backtest date range
startDate = input(title="Start Date", type=input.integer,
     defval=1, minval=1, maxval=31)
startMonth = input(title="Start Month", type=input.integer,
     defval=1, minval=1, maxval=12)
startYear = input(title="Start Year", type=input.integer,
     defval=2018, minval=1800, maxval=2100)
endDate = input(title="End Date", type=input.integer,
     defval=1, minval=1, maxval=31)
endMonth = input(title="End Month", type=input.integer,
     defval=11, minval=1, maxval=12)
endYear = input(title="End Year", type=input.integer,
     defval=2030, minval=1800, maxval=2100)
// Look if the close time of the current bar
// falls inside the date range
inDateRange =  true

//波段多
if (inDateRange and crossunder(f3,f1))//
    strategy.entry("buy", strategy.long,1, when=macd>0, comment = "買Long-term")
buyclose=crossunder(f3,f5)
strategy.close("buy", when = buyclose, comment = "關Long-term")
//多策略1
if (inDateRange and crossover(low , f3) and macd>0 and f3>f6)
    strategy.entry("buy1", strategy.long,100, comment = "買Mid-term")
buyclose1=crossunder(close,upper*0.999)
if (macd<0 or f3<f6)
    strategy.close("buy1", comment = "關Mid-term")
//strategy.close("buy1",when=cross(basis,close), comment = "關M",qty_percent=50)
strategy.close("buy1", when = buyclose1, comment = "關Mid-term",qty_percent=100)
//多策略3
if (inDateRange and  (macd>0) and crossunder(low,f1) and f1>f4) //
    strategy.entry("buy3", strategy.long,1, comment = "買Short-term")
buyclose3=crossunder(close,upper*0.999)
if (macd<0 or f1<f4)
    strategy.close("buy3", comment = "關Short-term")
strategy.close("buy3", when = buyclose3, comment = "關Short-term")
//多策略4
if (inDateRange and  (macd>0) and crossunder(low,f5) and f4>f5) //
    strategy.entry("buy4", strategy.long,1, comment = "買Long-term")
buyclose4=crossunder(close,upper*0.999)
if (macd<0 or f4<f6)
    strategy.close("buy4", comment = "關Long-term")
strategy.close("buy4", when = buyclose4, comment = "關Long-term")

//空策略1
if (inDateRange and  (macd<0) and crossunder(high,f1) and f1<f3 and f3<f6) //
    strategy.entry("sell1", strategy.short,1, comment = "空Short-term")
sellclose1=crossunder(lower*0.999,close)
if (macd>0 or f1>f4)
    strategy.close("sell1", comment = "關空Short-term")
strategy.close("sell1", when = sellclose1, comment = "關空Short-term")
//空策略2
if (inDateRange and  (macd<0) and crossunder(high,f4) and f4<f6) //
    strategy.entry("sell2", strategy.short,1, comment = "空Mid-term")
sellclose2=crossunder(lower,close)
if (macd>0 or f4>f6)
    strategy.close("sell2", comment = "關空Mid-term")
strategy.close("sell2", when = sellclose2, comment = "關Mid-term")
//空策略3
if (inDateRange and (macd<0) and crossunder(high,f6)) //
    strategy.entry("sell3", strategy.short,1, comment = "空Long-term")
sellclose3=crossunder(lower,close)
if (macd>0 or f6>f7)
    strategy.close("sell3", comment = "關空Long-term")
strategy.close("sell3", when = sellclose3, comment = "關空Long-term")