डबल वोलैटिलिटी बैंड ट्रंकेशन रणनीति
अवलोकन
दोहरी लहर बैंड काटने की रणनीति एक लघु रेखा ट्रेडिंग रणनीति है जो लहर बैंड संकेतकों का उपयोग करती है। यह तेजी से और धीमी गति से दो अलग-अलग पैरामीटर सेटिंग्स के साथ दो लहर बैंड का उपयोग करता है, व्यापार के अवसरों की तलाश करता है जब लहर बैंड ऊपर या नीचे टूट जाता है।
रणनीति सिद्धांत
इस रणनीति में एक साथ 20 और 50 की लंबाई के साथ एक मानक अंतर के साथ तेजी से और धीमी गति से उतार-चढ़ाव के बैंड का उपयोग किया जाता है। जब समापन मूल्य तेजी से उतार-चढ़ाव के बैंड को पार कर जाता है, तो यह समापन मूल्य के साथ एक बहुविकल्पी स्थिति में प्रवेश करता है; जब समापन मूल्य तेजी से उतार-चढ़ाव के बैंड को पार करता है, तो यह समापन मूल्य के साथ एक रिक्त स्थिति में प्रवेश करता है।
एक बार स्थिति में प्रवेश करने के बाद, रणनीति आगे की पुष्टि के संकेत के रूप में धीमी गति से उतार-चढ़ाव के बैंड को पार करने के लिए प्रतीक्षा करती है। इसके अलावा, रणनीति रुझान की दिशा का आकलन करने के लिए आरएसआई संकेतक के साथ संयुक्त है। केवल जब आरएसआई 50 से ऊपर होता है, तो यह एक खरीद संकेत है जो ट्रैक को तोड़ने पर विचार करता है; केवल जब आरएसआई 50 से नीचे होता है, तो यह एक बेचने का संकेत है जो ट्रैक को तोड़ता है।
स्थिति की स्थापना के बाद, यदि कीमत फिर से तेजी से उतार-चढ़ाव की पट्टी को पार करती है, तो संबंधित बहु-हेड या रिक्त-हेड पदों को बाहर निकाल दिया जाएगा।
श्रेष्ठता विश्लेषण
दोहरी लहर बैंड काटने की रणनीति का लाभ मुख्य रूप से छोटे कदमों को पकड़ने की क्षमता में दिखाई देता है। तेज लहर बैंड के माध्यम से छोटे मूल्य के ब्रेकडाउन को पकड़ने के लिए, धीमी लहर बैंड संकेतों को फिर से सत्यापित करने के लिए, नकली ब्रेकडाउन के शोर को फ़िल्टर करने के लिए और इससे लाभ उठाने के लिए। साथ ही, आरएसआई सूचक का संयोजन बड़े रुझान के उलटफेर से बचने के लिए भी किया जा सकता है।
इसके अलावा, दोहरी लहर बैंड अपने आप में एक गतिशीलता संकेतक के रूप में, यह निर्धारित करने के लिए बहुत अच्छा है कि क्या बाजार वर्तमान में उच्च गतिशीलता चरण में है, जो एक शॉर्ट-लाइन ट्रेडिंग रणनीति के लिए बहुत फायदेमंद है।
जोखिम विश्लेषण
इस रणनीति का मुख्य जोखिम यह है कि द्वि-तरंग बैंड द्वारा उत्पन्न ट्रेडिंग सिग्नल बहुत अधिक बार हो सकते हैं और बाजार के शोर को प्रभावी ढंग से फ़िल्टर नहीं कर सकते हैं। इससे बहुत अधिक गलत ट्रेडिंग हानि हो सकती है। इसके अलावा, कम गति के चरण में, तरंग बैंड की चौड़ाई कम हो जाती है और ट्रेडिंग के अवसर कम हो जाते हैं।
जोखिम को कम करने के लिए, आवृत्ति बैंड मापदंडों को समायोजित करने, धीमी आवृत्ति बैंड का उपयोग करने, या मैन्युअल रूप से सिग्नल की पुष्टि करने पर विचार किया जा सकता है। रणनीति की स्थिरता में सुधार के लिए अन्य तकनीकी संकेतकों जैसे कि मैकड, केडीजे आदि के साथ संयोजन भी किया जा सकता है।
अनुकूलन दिशा
इस रणनीति के लिए अनुकूलन का स्थान मुख्य रूप से उतार-चढ़ाव के पैरामीटर और आरएसआई पैरामीटर को समायोजित करने पर केंद्रित है। उदाहरण के लिए, विभिन्न लंबाई चक्रों के लिए तेज और धीमी उतार-चढ़ाव के पैरामीटर का परीक्षण करके सबसे अच्छा संयोजन ढूंढें। या विभिन्न लंबाई चक्रों के लिए आरएसआई संकेतक पैरामीटर का प्रयास करें और देखें कि क्या यह रणनीति के प्रदर्शन में सुधार कर सकता है।
एक अन्य अनुकूलन दिशा है जोड़े या स्टॉप लॉजिक को समायोजित करना। वर्तमान रणनीति में स्टॉप लॉजिक सेट नहीं किया गया है, जो रणनीति की अधिकतम वापसी के जोखिम को बढ़ाता है। उचित रूप से सेट किए गए फिक्स्ड रेश्यो स्टॉप या ट्रैक किए गए स्टॉप लॉजिक से जोखिम-लाभ में काफी सुधार हो सकता है।
संक्षेप
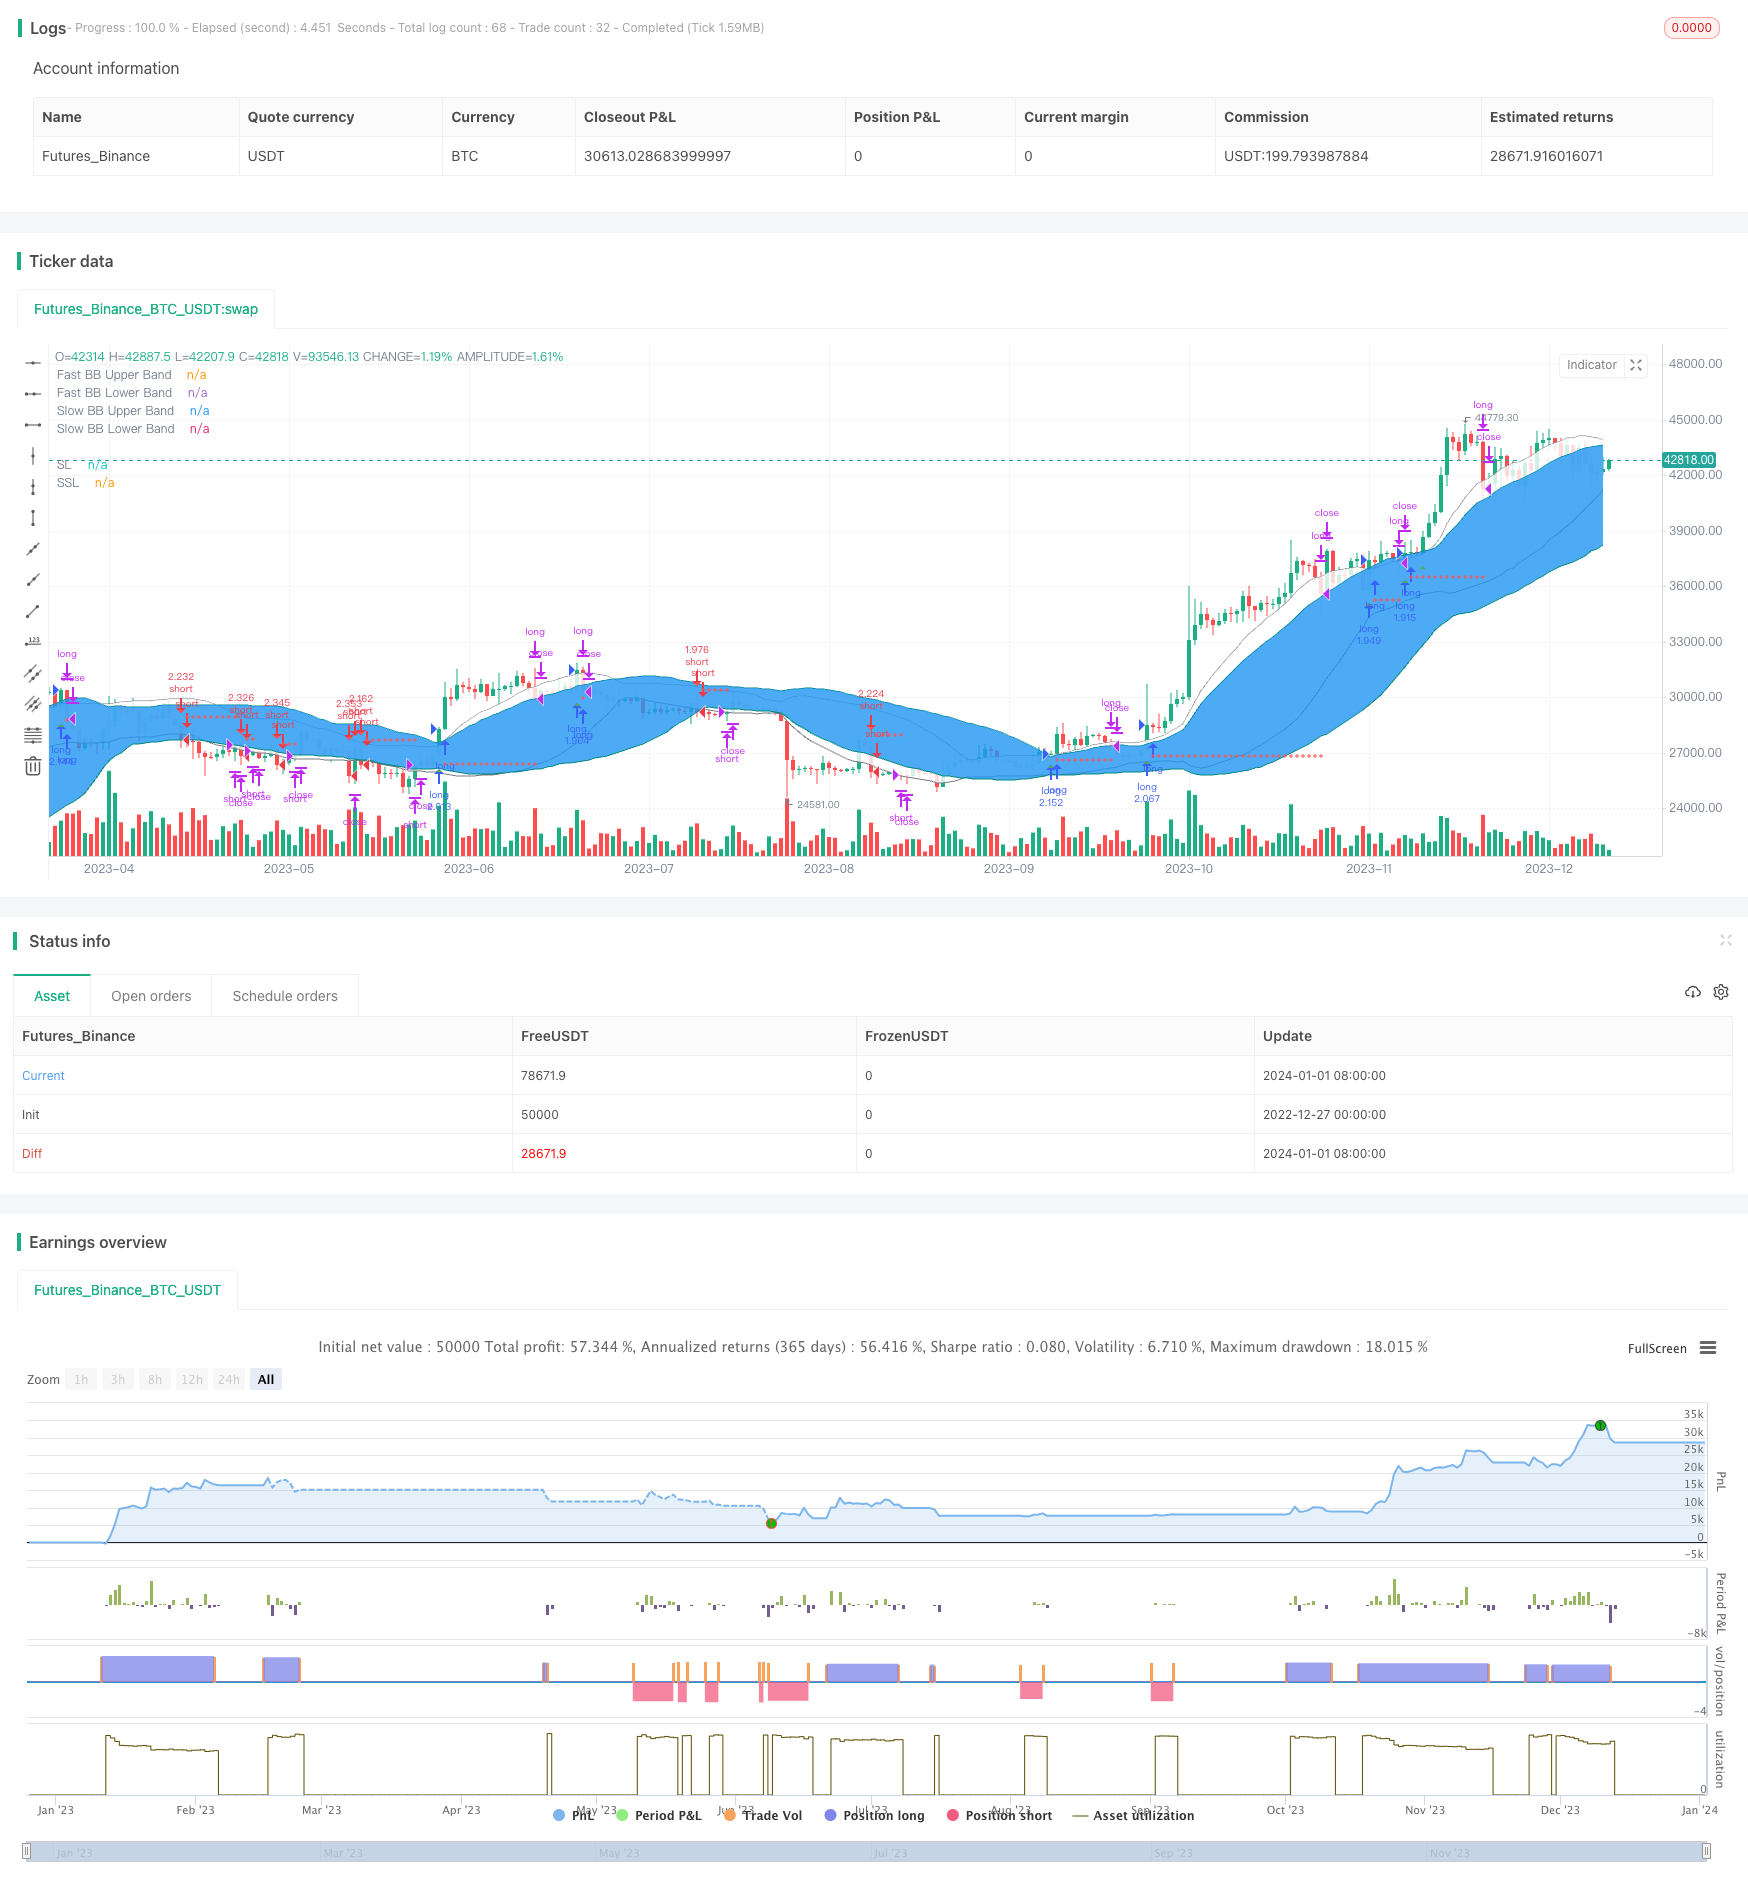
डबल वेवलेंथ बैंड काटना एक छोटी लाइन ट्रेडिंग रणनीति है जो बाजार की गतिशीलता के प्रति संवेदनशील है। यह उच्च अस्थिरता के दौरान छोटे मूल्य आंदोलनों को पकड़ सकता है और डबल वेवलेंथ बैंड संकेतक के स्पष्ट संकेत के बाद व्यापार कर सकता है। हालांकि, इस रणनीति की विश्वसनीयता को और सत्यापित किया जाना बाकी है, और पैरामीटर अनुकूलन और स्टॉप लॉजिक के अलावा, रणनीति की स्थिरता को और बेहतर बनाने की उम्मीद है।
/*backtest
start: 2022-12-27 00:00:00
end: 2024-01-02 00:00:00
period: 1d
basePeriod: 1h
exchanges: [{"eid":"Futures_Binance","currency":"BTC_USDT"}]
*/

// This source code is subject to the terms of the Mozilla Public License 2.0 at https://mozilla.org/MPL/2.0/

// From "Bitcoin Trading Strategies: Algorithmic Trading Strategies For Bitcoin And Cryptocurrency That Work" by David Hanson.

// "Double Bolinger Band Scalping System
// Recommended Timeframe: 1 minute or 5 minute

// Required Indicators:
// - RSI with a length of 14 (default settings)
// - Bolinger band #1 settings: Length = 50, stDev = 1 Hide the basis/middle line (basis line not needed for this strategy)
// Note: This is the slower bolinger band in the directions
// - Bolinger band #2 settings: Length 20, stDev = 1 Hide the basis/middle line (basis line not needed for this strategy)
// Note: This is the faster bolinger band in the directions

// Enter Long/Buy Trade When:
// - RSI is above the level 50
// - A candle closes above the top of the faster bolinger band
// Enter a long when a candle then closes above the top of the slower bolinger band, and price is above the top of both bands
// Place a stop loss under the low of the entry candle Example of a long trade using this strategy
// Exit Long Trade When: A candle closes below the top band of the fast bolinger band

// Enter Short/Sell Trade When:
// - RSI is below the level 50
// - A candle closes below the bottom of the faster bolinger band
// Enter a short when a candle then closes below the bottom of the slower bolinger band, and price is below both bands
// Place a stop loss above the high of the entry candle Example of a short trade using this strategy
// Exit Short Trade When: Price closes inside the bottom of the faster bolinger band"

// © tweakerID

//@version=4
strategy("Double Bollinger Strategy",
     overlay=true,
     default_qty_type=strategy.percent_of_equity,
     default_qty_value=100,
     initial_capital=10000,
     commission_value=0.04,
     calc_on_every_tick=false,
     slippage=0)

direction = input(0, title = "Strategy Direction", type=input.integer, minval=-1, maxval=1)
strategy.risk.allow_entry_in(direction == 0 ? strategy.direction.all : (direction < 0 ? strategy.direction.short : strategy.direction.long))

/////////////////////// STRATEGY INPUTS ////////////////////////////////////////
title1=input(true, "-----------------Strategy Inputs-------------------")

i_RSI=input(14, title="RSI Length")
lengthS = input(45, minval=1, title="Slow BB Band Length")
lengthF = input(31, minval=1, title="Fast BB Band Length")

/////////////////////// BACKTESTER /////////////////////////////////////////////
title2=input(true, "-----------------General Inputs-------------------")

// Backtester General Inputs
i_SL=input(true, title="Use Stop Loss and Take Profit")
i_SLType=input(defval="Strategy Stop", title="Type Of Stop", options=["Strategy Stop", "Swing Lo/Hi", "ATR Stop"])
i_SPL=input(defval=10, title="Swing Point Lookback")
i_PercIncrement=input(defval=1, step=.1, title="Swing Point SL Perc Increment")*0.01
i_ATR = input(14, title="ATR Length")
i_ATRMult = input(5, step=.1, title="ATR Multiple")
i_TPRRR = input(2, step=.1, title="Take Profit Risk Reward Ratio")
TS=input(false, title="Trailing Stop")

// Bought and Sold Boolean Signal
bought = strategy.position_size > strategy.position_size[1]
 or strategy.position_size < strategy.position_size[1]

// Price Action Stop and Take Profit
LL=(lowest(i_SPL))*(1-i_PercIncrement)
HH=(highest(i_SPL))*(1+i_PercIncrement)
LL_price = valuewhen(bought, LL, 0)
HH_price = valuewhen(bought, HH, 0)
entry_LL_price = strategy.position_size > 0 ? LL_price : na
entry_HH_price = strategy.position_size < 0 ? HH_price : na
tp=strategy.position_avg_price + (strategy.position_avg_price - entry_LL_price)*i_TPRRR
stp=strategy.position_avg_price - (entry_HH_price - strategy.position_avg_price)*i_TPRRR

// ATR Stop
ATR=atr(i_ATR)*i_ATRMult
ATRLong = ohlc4 - ATR
ATRShort = ohlc4 + ATR
ATRLongStop = valuewhen(bought, ATRLong, 0)
ATRShortStop = valuewhen(bought, ATRShort, 0)
LongSL_ATR_price = strategy.position_size > 0 ? ATRLongStop : na
ShortSL_ATR_price = strategy.position_size < 0 ? ATRShortStop : na
ATRtp=strategy.position_avg_price + (strategy.position_avg_price - LongSL_ATR_price)*i_TPRRR
ATRstp=strategy.position_avg_price - (ShortSL_ATR_price - strategy.position_avg_price)*i_TPRRR


// Strategy Stop
float LongStop = valuewhen(bought,low[1],0)*(1-i_PercIncrement)
float ShortStop = valuewhen(bought,high[1],0)*(1+i_PercIncrement)
float StratTP = na
float StratSTP = na

/////////////////////// STRATEGY LOGIC /////////////////////////////////////////

//RSI
RSI=rsi(close, i_RSI)

//BOLL1
[middleS, upperS, lowerS] = bb(close, lengthS, 1)
p1 = plot(upperS, "Slow BB Upper Band", color=color.teal)
p2 = plot(lowerS, "Slow BB Lower Band", color=color.teal)
fill(p1, p2, title = "Slow BB Background", color=color.blue, transp=95)

//BOLL2
[middleF, upperF, lowerF] = bb(close, lengthF, 1)
p1F = plot(upperF, "Fast BB Upper Band", color=color.gray)
p2F = plot(lowerF, "Fast BB Lower Band", color=color.gray)
fill(p1F, p2F, title = "Fast BB Background", color=color.white, transp=95)


BUY = bar_index > 40 and (RSI > 50) and (close > upperF) and crossover(close, upperS)
SELL = bar_index > 40 and (RSI < 50) and (close < lowerF) and crossunder(close, lowerS)

longexit=close < upperF
shortexit=close > lowerF

//Trading Inputs
i_strategyClose=input(true, title="Use Strategy Close Logic")
DPR=input(true, "Allow Direct Position Reverse")
reverse=input(false, "Reverse Trades")

// Entries
if reverse
    if not DPR
        strategy.entry("long", strategy.long, when=SELL and strategy.position_size == 0)
        strategy.entry("short", strategy.short, when=BUY and strategy.position_size == 0)
    else
        strategy.entry("long", strategy.long, when=SELL)
        strategy.entry("short", strategy.short, when=BUY)
else
    if not DPR
        strategy.entry("long", strategy.long, when=BUY and strategy.position_size == 0)
        strategy.entry("short", strategy.short, when=SELL and strategy.position_size == 0)
    else
        strategy.entry("long", strategy.long, when=BUY)
        strategy.entry("short", strategy.short, when=SELL)

if i_strategyClose
    strategy.close("long", when=longexit)
    strategy.close("short", when=shortexit)


SL= i_SLType == "Swing Lo/Hi" ? entry_LL_price : i_SLType == "ATR Stop" ? LongSL_ATR_price : LongStop
SSL= i_SLType == "Swing Lo/Hi" ? entry_HH_price : i_SLType == "ATR Stop" ? ShortSL_ATR_price : ShortStop
TP= i_SLType == "Swing Lo/Hi" ? tp : i_SLType == "ATR Stop" ? ATRtp : StratTP
STP= i_SLType == "Swing Lo/Hi" ? stp : i_SLType == "ATR Stop" ? ATRstp : StratSTP

//TrailingStop
dif=(valuewhen(strategy.position_size>0 and strategy.position_size[1]<=0, high,0))
 -strategy.position_avg_price
trailOffset     = strategy.position_avg_price - SL
var tstop = float(na)
if strategy.position_size > 0
    tstop := high- trailOffset - dif
    if tstop<tstop[1]
        tstop:=tstop[1]
else
    tstop := na
StrailOffset     = SSL - strategy.position_avg_price
var Ststop = float(na)
Sdif=strategy.position_avg_price-(valuewhen(strategy.position_size<0
 and strategy.position_size[1]>=0, low,0))
if strategy.position_size < 0
    Ststop := low+ StrailOffset + Sdif
    if Ststop>Ststop[1]
        Ststop:=Ststop[1]
else
    Ststop := na

strategy.exit("TP & SL", "long", limit=TP, stop=TS? tstop : SL, when=i_SL)
strategy.exit("TP & SL", "short", limit=STP, stop=TS? Ststop : SSL, when=i_SL)

/////////////////////// PLOTS //////////////////////////////////////////////////


plot(i_SL and strategy.position_size > 0 and not TS ? SL : i_SL and strategy.position_size > 0 and TS ? tstop : na , title='SL', style=plot.style_cross, color=color.red)
plot(i_SL and strategy.position_size < 0 and not TS ? SSL : i_SL and strategy.position_size < 0 and TS ? Ststop : na , title='SSL', style=plot.style_cross, color=color.red)
plot(i_SL and strategy.position_size > 0 ? TP : na, title='TP', style=plot.style_cross, color=color.green)
plot(i_SL and strategy.position_size < 0 ? STP : na, title='STP', style=plot.style_cross, color=color.green)
// Draw price action setup arrows
plotshape(BUY ? 1 : na, style=shape.triangleup, location=location.belowbar,
 color=color.green, title="Bullish Setup", size=size.auto)
plotshape(SELL ? 1 : na, style=shape.triangledown, location=location.abovebar,
 color=color.red, title="Bearish Setup", size=size.auto)