अनुकूली कॉफ़मैन मूविंग एवरेज ट्रेंड फ़ॉलोइंग रणनीति
अवलोकन
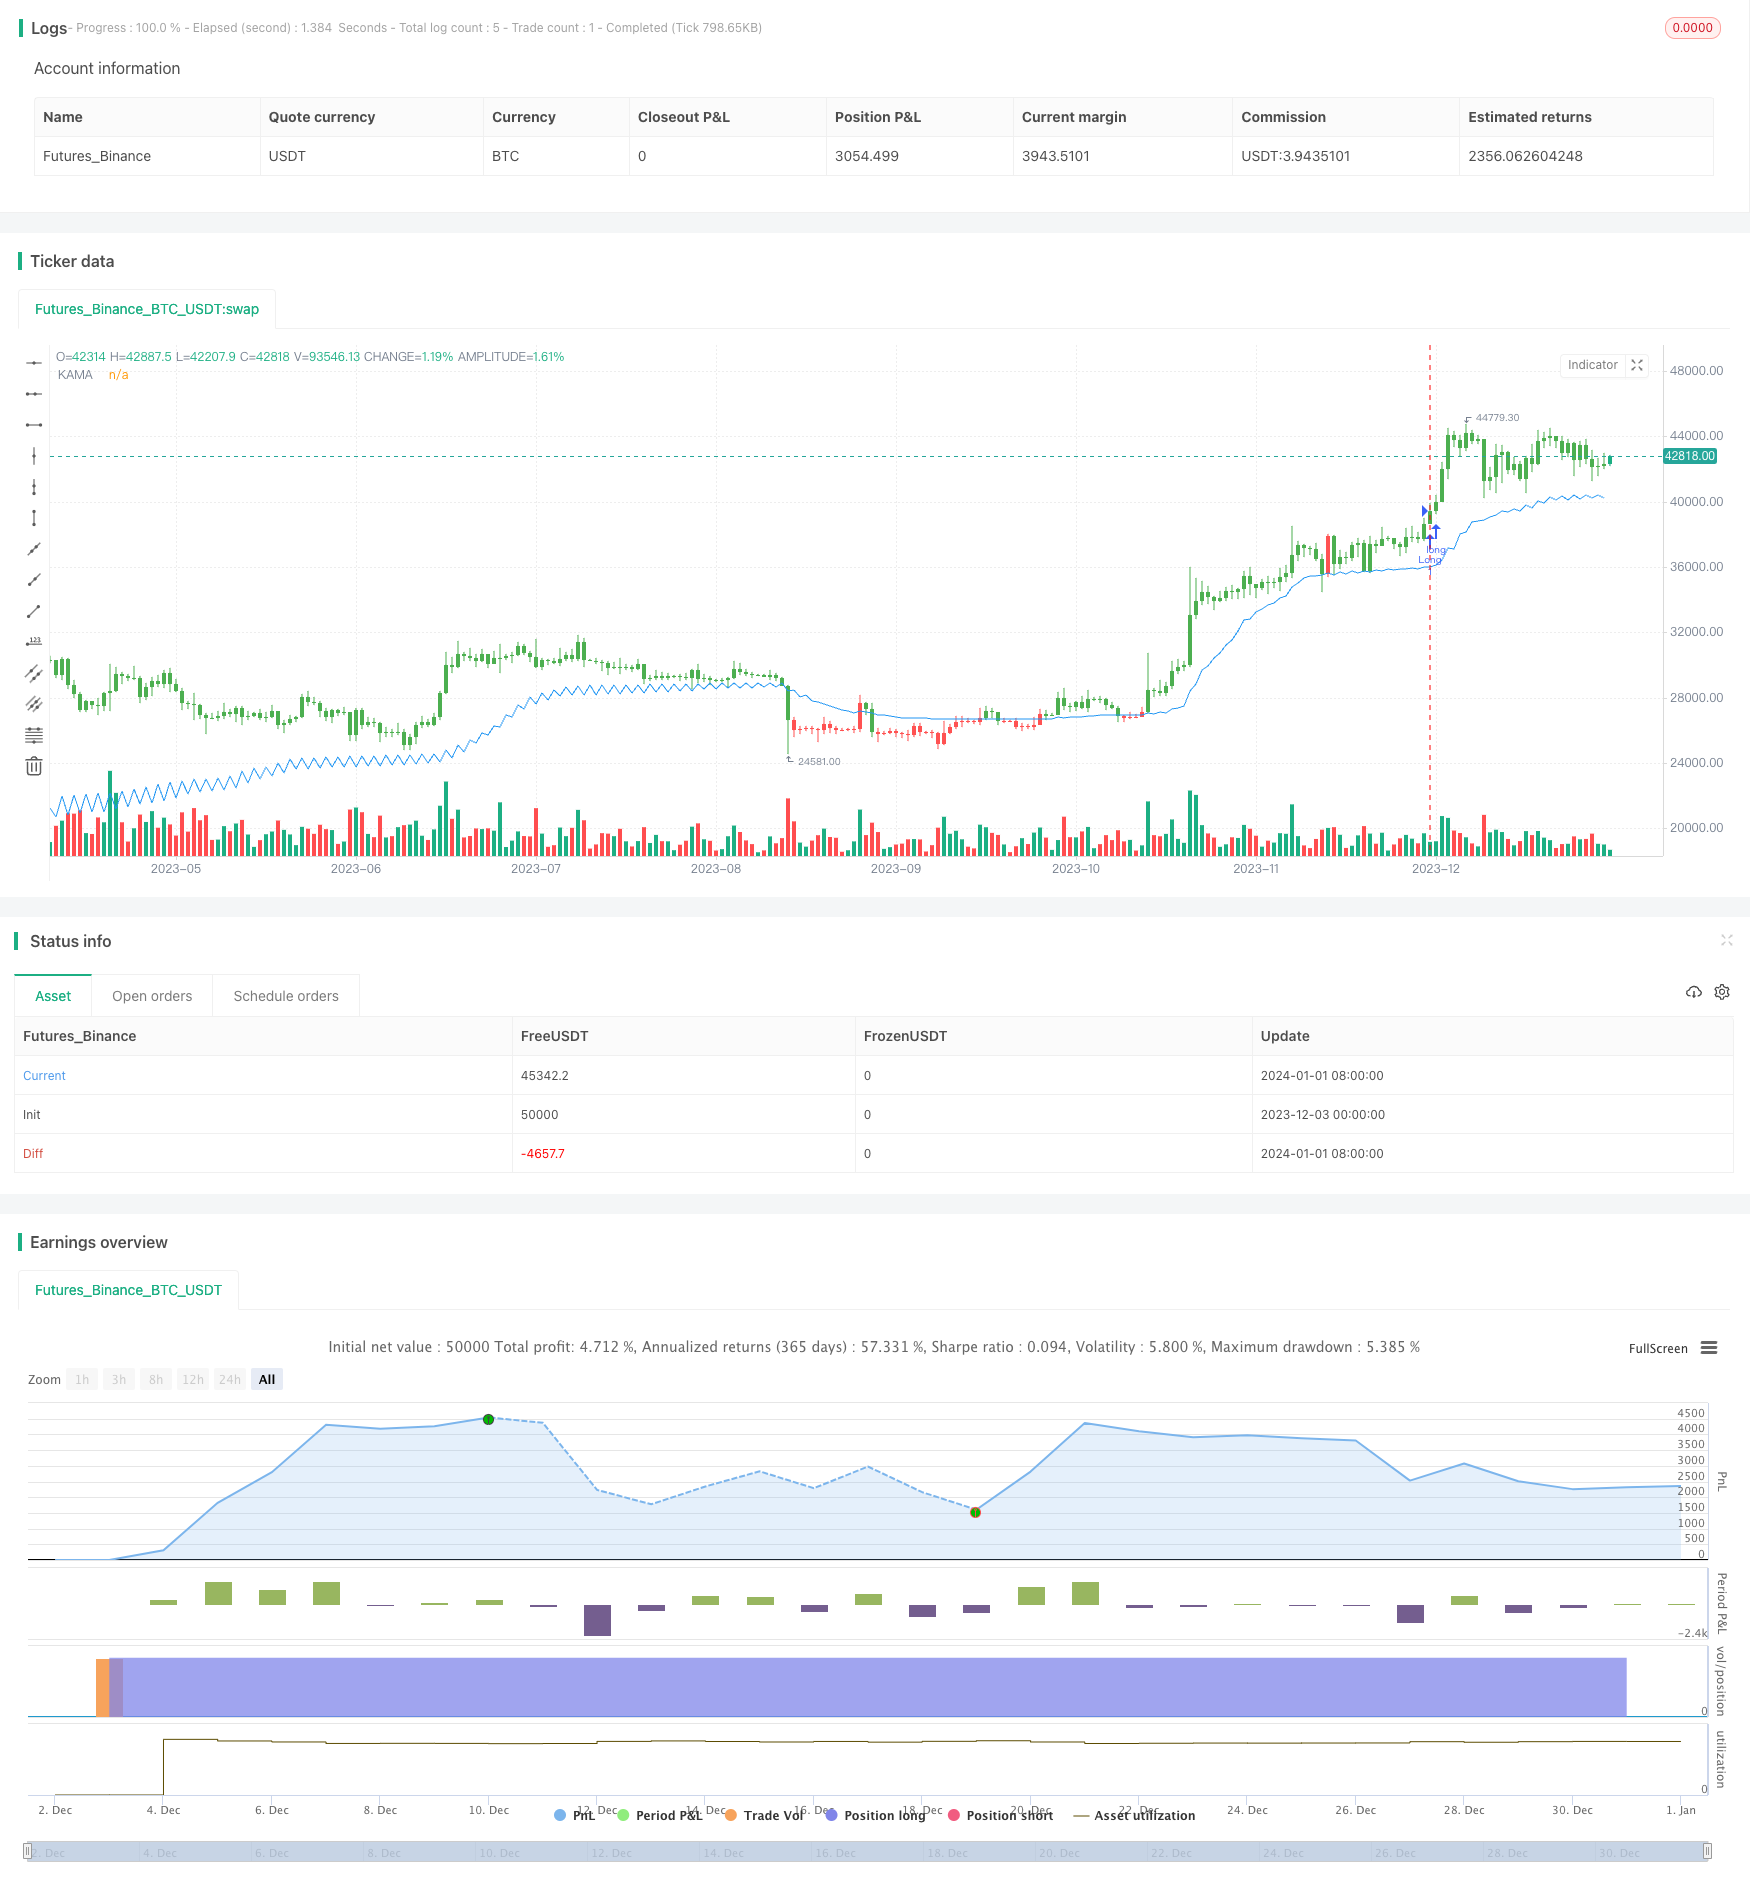
इस रणनीति में कीमतों के रुझानों को ट्रैक करने के लिए अनुकूलनशील चलती औसत (KAMA) का उपयोग किया जाता है, जिससे कम खरीदना और अधिक बेचना संभव हो जाता है, जिससे लाभ होता है।
रणनीति सिद्धांत
काफ़मैन स्व-अनुकूलित चलती औसत (KAMA) सूचकांक के लिए गणना सूत्र हैः
nAMA = nz(nAMA[1]) + nsmooth * (Close - nz(nAMA[1]))

其中:

nsmooth = (nefratio * (nfastend - nslowend) + nslowend)^2

nefratio = nsignal / nnoise

nsignal = |Close - Close[Length]|

nnoise = sum(|Close - Close[1]|, Length)

nfastend = 0.666

nslowend = 0.0645
इस सूचकांक का सारांश बाजार में उतार-चढ़ाव और मूल्य परिवर्तन के रुझानों को ध्यान में रखता है, जिससे कीमतों के रुझानों को अधिक तेज़ी से ट्रैक किया जा सकता है।
- जब बाजार में कम उतार-चढ़ाव होता है, तो nsmooth nslowend के करीब होता है, और KAMA लाइन धीरे-धीरे बदलती है, जिससे बाजार का शोर कम हो जाता है।
- जब बाजार में उतार-चढ़ाव बढ़ता है और रुझान दिखाई देता है, तो nsmooth nfastend के करीब होता है, KAMA लाइन तेजी से बदलती है और रुझानों को ट्रैक करती है।
मूल्य और KAMA के बीच संबंधों की तुलना करके, यह निर्धारित किया जा सकता है कि मूल्य की प्रवृत्ति किस दिशा में है, ताकि अधिक खाली करने का निर्णय लिया जा सके।
रणनीतिक लाभ
इस रणनीति का सबसे बड़ा लाभ यह है कि कीमतों के रुझान में परिवर्तन को ट्रैक करने के लिए अनुकूलनशील चलती औसत का उपयोग किया जाता है, जिससे शोर के प्रभाव को कम किया जा सकता है, और ट्रैक करने में अच्छा प्रभाव पड़ता है। विशिष्ट लाभ इस प्रकार हैंः
- KAMA सूचकांक बाजार के शोर को रोकता है और अनावश्यक ट्रेडों के संयोजन को कम करता है।
- KAMA सूचकांक मूल्य परिवर्तन के रुझानों के लिए तेजी से प्रतिक्रिया देता है और इसका अच्छा प्रभाव होता है।
- रणनीतिक निर्णय लेने के नियम सरल, स्पष्ट, समझने और लागू करने में आसान हैं।
- विभिन्न बाजार स्थितियों के लिए विन्यास योग्य रिवर्स ट्रेडिंग
रणनीतिक जोखिम
इस रणनीति के कुछ जोखिम भी हैं:
- आघात की स्थिति में, KAMA संकेतक में त्रुटि संकेत हो सकता है। पैरामीटर को समायोजित करके संकेतक प्रभाव को अनुकूलित किया जा सकता है।
- अनुवर्ती देरी मौजूद है, अल्पकालिक मूल्य उलट को याद किया जा सकता है। यदि आवश्यक हो तो अन्य संकेतकों के साथ निदान किया जा सकता है।
- ट्रेडिंग शुल्क और स्लाइड पॉइंट को ध्यान में रखे बिना, फिक्स्ड डिस्क का प्रभाव फीडबैक से कम होता है।
रणनीति अनुकूलन दिशा
इस रणनीति को निम्नलिखित पहलुओं से भी अनुकूलित किया जा सकता हैः
- KAMA मापदंडों का अनुकूलन करें और संकेतक की ट्रैकिंग संवेदनशीलता में सुधार करें।
- एक एकल लेनदेन के लिए अधिकतम नुकसान को नियंत्रित करने के लिए स्टॉप लॉस मैकेनिज्म को बढ़ाएं।
- अन्य संकेतकों के साथ मिलकर, फ़िल्टर सिग्नल निर्णय लेने की सटीकता में सुधार करते हैं।
- प्रवृत्तियों को आगे बढ़ाने के लिए पुनः प्रवेश तंत्र जोड़ा गया।
संक्षेप
इस रणनीति का उपयोग Kaufman अनुकूलन चलती औसत सूचक कीमत की प्रवृत्ति को ट्रैक करने के लिए, निर्णय नियम सरल और स्पष्ट है, फिक्स्ड ऑपरेशन आसान. यह सूचक शोर को दबाने के साथ-साथ कीमत में बदलाव के लिए तेजी से प्रतिक्रिया करता है, ट्रैक करने के लिए अच्छा प्रभाव है, एक सिफारिश की प्रवृत्ति ट्रैक रणनीति है.
/*backtest
start: 2023-12-03 00:00:00
end: 2024-01-02 00:00:00
period: 1d
basePeriod: 1h
exchanges: [{"eid":"Futures_Binance","currency":"BTC_USDT"}]
*/

//@version=2
////////////////////////////////////////////////////////////
//  Copyright by HPotter v1.0 25/08/2017
// Everyone wants a short-term, fast trading trend that works without large
// losses. That combination does not exist. But it is possible to have fast
// trading trends in which one must get in or out of the market quickly, but
// these have the distinct disadvantage of being whipsawed by market noise
// when the market is volatile in a sideways trending market. During these
// periods, the trader is jumping in and out of positions with no profit-making
// trend in sight. In an attempt to overcome the problem of noise and still be
// able to get closer to the actual change of the trend, Kaufman developed an
// indicator that adapts to market movement. This indicator, an adaptive moving
// average (AMA), moves very slowly when markets are moving sideways but moves
// swiftly when the markets also move swiftly, change directions or break out of
// a trading range.
//
// You can change long to short in the Input Settings
// Please, use it only for learning or paper trading. Do not for real trading.
////////////////////////////////////////////////////////////
strategy(title="Kaufman Moving Average Adaptive (KAMA)", shorttitle="Kaufman Moving Average Adaptive (KAMA)", overlay = true)
Length = input(21, minval=1)
xPrice = close
xvnoise = abs(xPrice - xPrice[1])
nfastend = 0.666
nslowend = 0.0645
reverse = input(false, title="Trade reverse")
nsignal = abs(xPrice - xPrice[Length])
nnoise = sum(xvnoise, Length)
nefratio = iff(nnoise != 0, nsignal / nnoise, 0)
nsmooth = pow(nefratio * (nfastend - nslowend) + nslowend, 2)
nAMA = nz(nAMA[1]) + nsmooth * (xPrice - nz(nAMA[1]))
pos = iff(close[1] > nAMA, 1,
	   iff(close[1] < nAMA, -1, nz(pos[1], 0)))
possig = iff(reverse and pos == 1, -1,
          iff(reverse and pos == -1, 1, pos))
if (possig == 1)
    strategy.entry("Long", strategy.long)
if (possig == -1)
    strategy.entry("Short", strategy.short)
barcolor(possig == -1 ? red: possig == 1 ? green : blue )
plot(nAMA, color=blue, title="KAMA")