ADX संकेतक पर आधारित अनुकूली ट्रेडिंग रणनीति
अवलोकन
इस रणनीति का मूल ADX सूचक का उपयोग करके बाजार की प्रवृत्ति का आकलन करना है और DI+- सूचक के अंतर के साथ स्वचालित रूप से पहचानने वाले ब्रेकआउट को जोड़ना है, ताकि स्व-अनुकूलित व्यापार किया जा सके। DI+ और ADX के बीच अंतर सेट थ्रेशोल्ड से अधिक होने पर अधिक करें, और DI- और ADX के बीच अंतर सेट थ्रेशोल्ड से अधिक होने पर शून्य करें। यह रणनीति स्वचालित रूप से ट्रेंड ब्रेकआउट की पहचान कर सकती है, बिना किसी मानवीय हस्तक्षेप के, मध्यम लंबी लाइन के लिए उपयुक्त है।
रणनीति सिद्धांत
True Range, Directional Movement को गणना करें और DI+, DI- और DX और ADX को प्राप्त करें।
DI+ और ADX के अंतर आयाम 1 और DI- और ADX के अंतर आयाम 2 की तुलना करें।
जब आयाम 1 सेट थ्रेशोल्ड से अधिक होता है तो एक बहु सिग्नल उत्पन्न होता है (जैसे 10); जब आयाम 2 सेट थ्रेशोल्ड से अधिक होता है (जैसे 10) तो एक शून्य सिग्नल उत्पन्न होता है।
और ADX को गलत संकेतों को फ़िल्टर करने के लिए डीआई+ और डीआई- के बीच में आने के लिए कहता है।
इस प्रकार, जब बाजार एक प्रवृत्ति की स्थिति में प्रवेश करता है, तो डीआई + या डीआई - स्पष्ट रूप से एडीएक्स से आगे निकल जाता है, जिससे एक व्यापार संकेत उत्पन्न होता है; जब बाजार की प्रवृत्ति समाप्त हो जाती है, तो डीआई +, डीआई - और एडीएक्स फिर से करीब आते हैं, पीछा करने से बचते हैं।
रणनीतिक लाभ
यह स्वचालित रूप से ट्रेंड ब्रेकआउट की पहचान करता है, और किसी भी मानवीय निर्णय की आवश्यकता नहीं होती है।
डीआई और एडीएक्स के बीच अंतर को अलग-अलग बाजार स्थितियों के अनुकूल करने के लिए टर्मिनल को लचीलापन से समायोजित करें।
एडीएक्स के साथ, यह गलत संकेतों को प्रभावी ढंग से फ़िल्टर कर सकता है।
शेयरों की लंबी अवधि, उच्च आवृत्ति वाले लेनदेन की आवश्यकता नहीं, उच्च पूंजी उपयोग दर।
यह भी पढ़ेंः
रणनीतिक जोखिम
ADX सूचकांक में देरी हो रही है, जिससे शॉर्ट-लाइन ट्रेडिंग के अवसरों को याद किया जा सकता है। इसे अन्य संकेतकों के साथ जोड़ा जा सकता है या ADX पैरामीटर को कम करके संवेदनशीलता बढ़ाया जा सकता है।
आपातकालीन स्थिति में आसानी से बंद कर दिया जाता है। स्टॉप-लॉस रणनीति या एडीएक्स फ़िल्टरिंग शर्तों को कम करने के लिए स्टॉप की संभावना को कम करने के लिए जोड़ा जा सकता है।
एक बड़े रुझान के उलट होने पर भारी नुकसान हो सकता है। जोखिम को नियंत्रित करने के लिए मोबाइल स्टॉप या ट्रैक स्टॉप सेट किया जा सकता है।
रणनीति अनुकूलन
विभिन्न बाजारों और किस्मों का परीक्षण करने के लिए सबसे अच्छा संयोजन को समायोजित करें।
सिग्नल की सटीकता को बढ़ाने के लिए अन्य मापदंडों के साथ संयोजन पर विचार किया जा सकता है, जैसे कि MACD, KD, आदि।
वापस लेने और अधिकतम नुकसान को नियंत्रित करने के लिए स्टॉप लॉस रणनीति को बढ़ाएं।
बाजार की स्थिति के अनुसार व्यापारिक स्थिति को समायोजित करने के लिए स्थिति प्रबंधन की शुरुआत करना।
व्यापार जोखिम को कम करने के लिए प्रवेश बिंदु चयन और बाहर निकलने की शर्तों का अनुकूलन करना।
संक्षेप
इस रणनीति में ADX और DI संकेतक के फायदे शामिल हैं, जिससे रुझानों का प्रभावी निर्णय और स्व-अनुकूली व्यापार संभव हो जाता है। मध्यम-लंबी लाइन के लिए उपयुक्त बार-बार संचालन की आवश्यकता नहीं है। इसके अलावा, कुछ जोखिम भी हैं, सहायक तकनीकी संकेतकों और धन प्रबंधन के साधनों में सुधार करने की आवश्यकता है, जिससे रणनीति की स्थिरता में काफी सुधार हो सकता है। यह रणनीति विचार विश्वसनीय, तार्किक रूप से स्पष्ट है, जो गहन अध्ययन और आवेदन के लायक है।
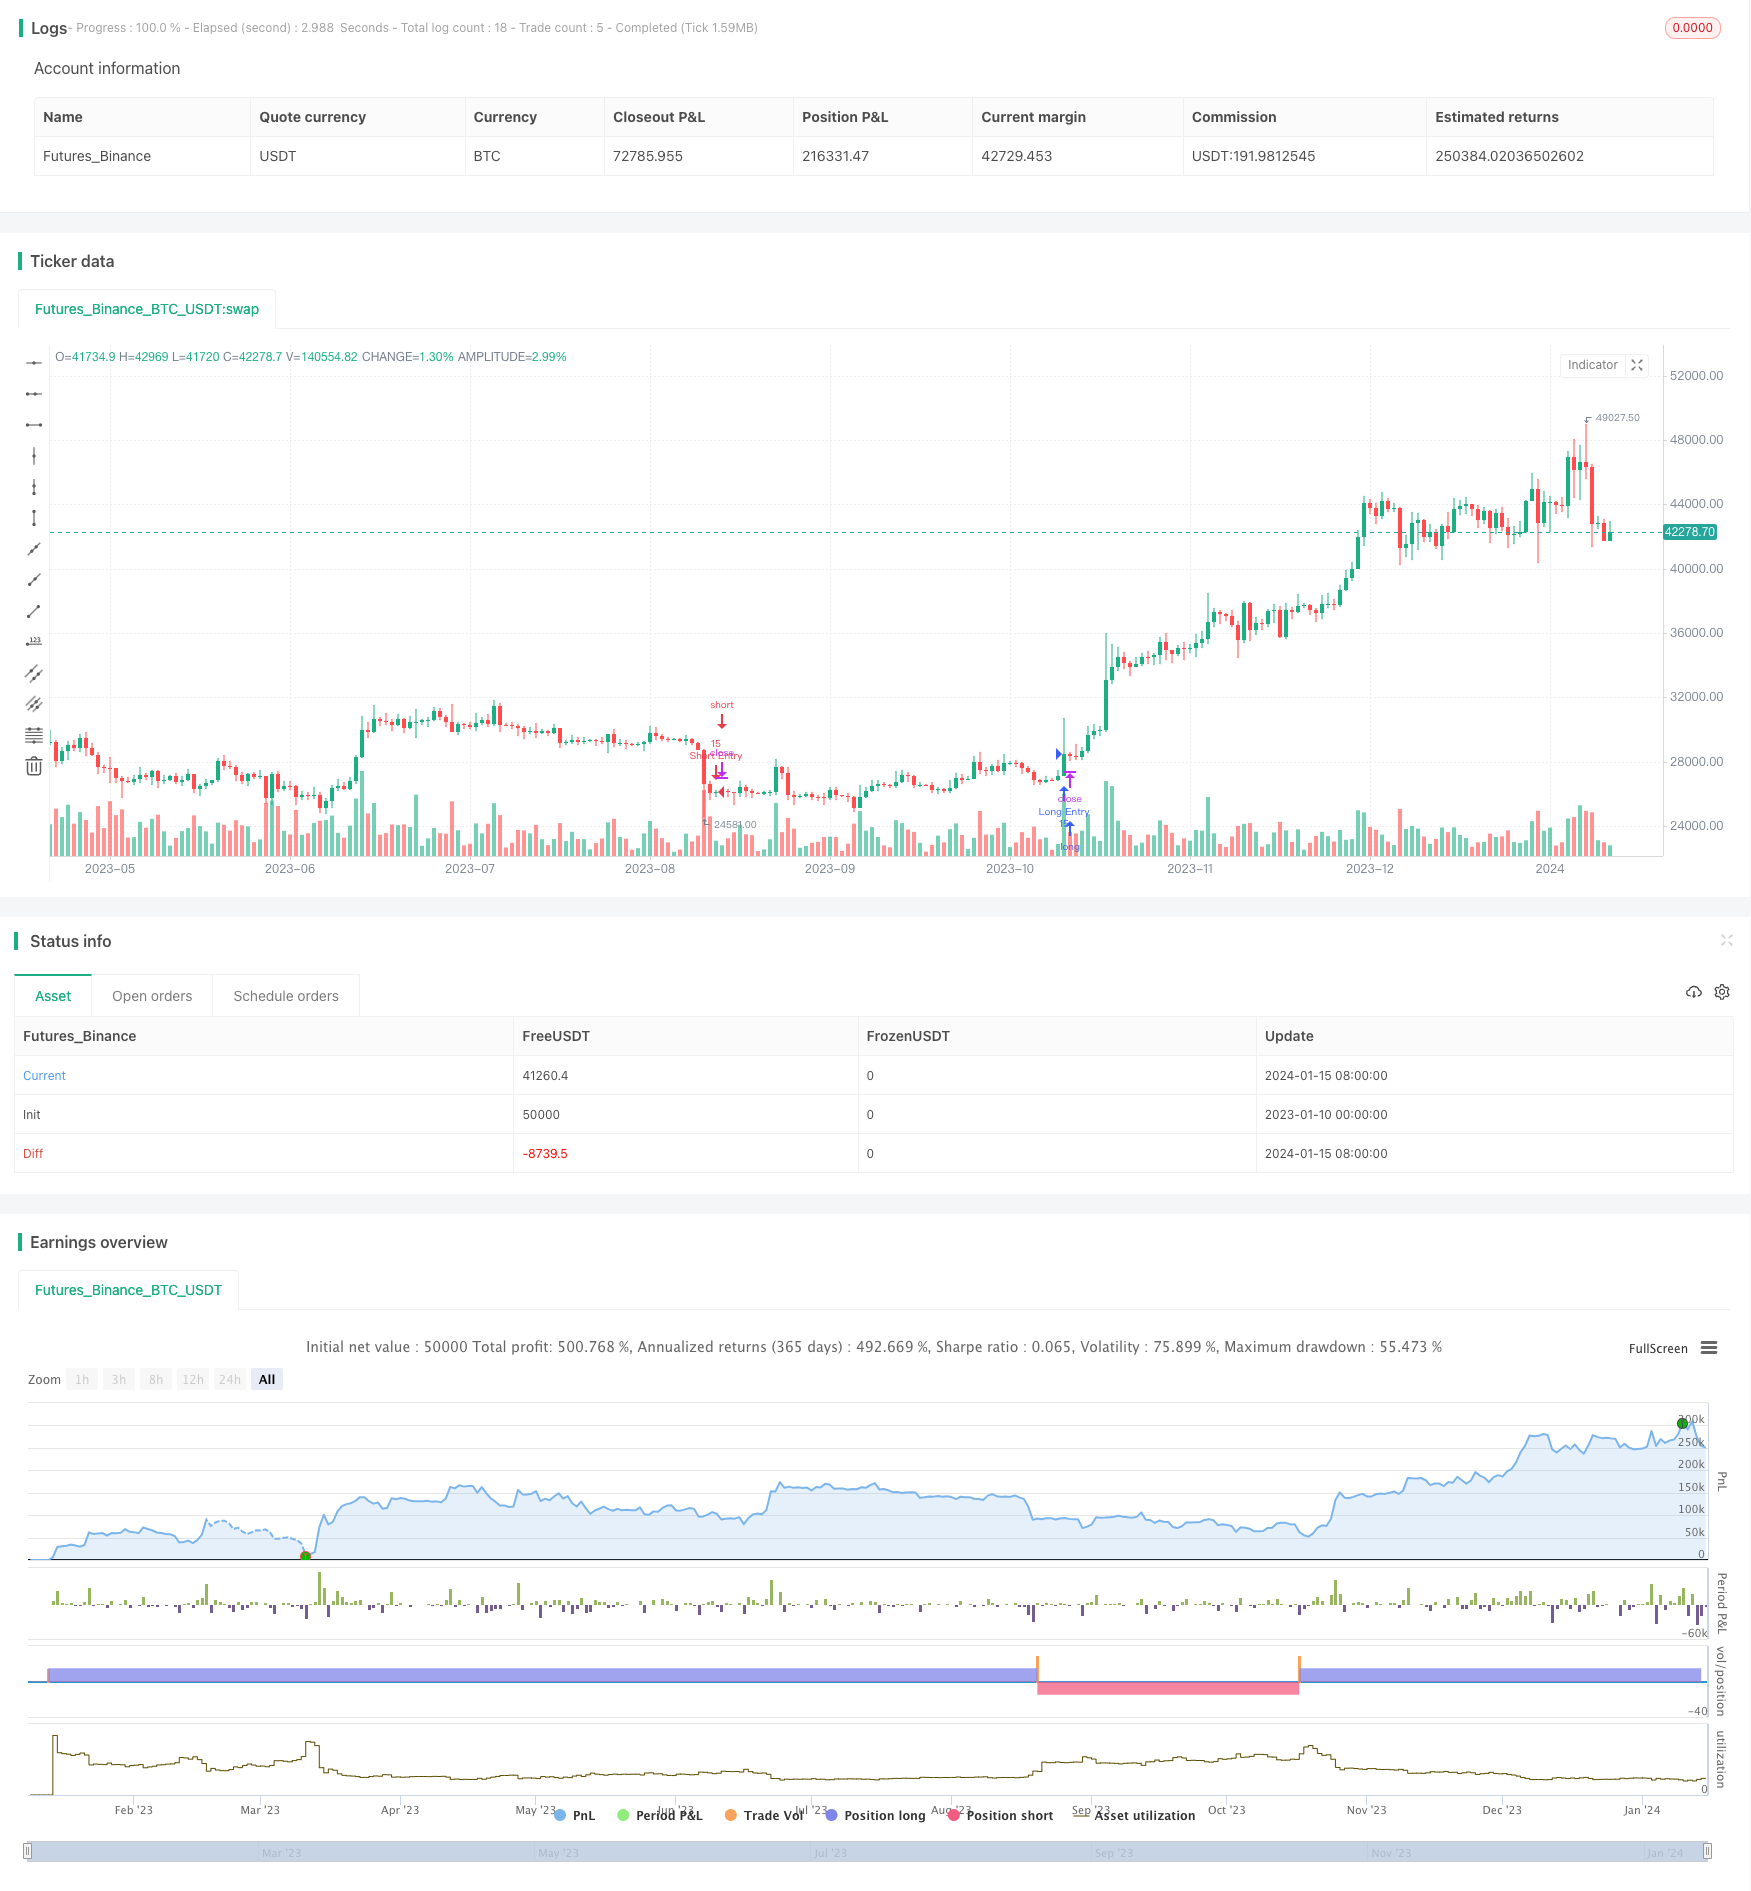
/*backtest
start: 2023-01-10 00:00:00
end: 2024-01-16 00:00:00
period: 1d
basePeriod: 1h
exchanges: [{"eid":"Futures_Binance","currency":"BTC_USDT"}]
*/

// This source code is subject to the terms of the Mozilla Public License 2.0 at https://mozilla.org/MPL/2.0/
// © MAURYA_ALGO_TRADER

//@version=5
strategy("Monthly Performance by Dr. Maurya", overlay=true, default_qty_value = 15, commission_type = strategy.commission.percent, commission_value = 0.1)


len = input(14)
th = input(20)

TrueRange = math.max(math.max(high - low, math.abs(high - nz(close[1]))), math.abs(low - nz(close[1])))
DirectionalMovementPlus = high - nz(high[1]) > nz(low[1]) - low ? math.max(high - nz(high[1]), 0) : 0
DirectionalMovementMinus = nz(low[1]) - low > high - nz(high[1]) ? math.max(nz(low[1]) - low, 0) : 0

SmoothedTrueRange = 0.0
SmoothedTrueRange := nz(SmoothedTrueRange[1]) - nz(SmoothedTrueRange[1]) / len + TrueRange

SmoothedDirectionalMovementPlus = 0.0
SmoothedDirectionalMovementPlus := nz(SmoothedDirectionalMovementPlus[1]) - nz(SmoothedDirectionalMovementPlus[1]) / len + DirectionalMovementPlus

SmoothedDirectionalMovementMinus = 0.0
SmoothedDirectionalMovementMinus := nz(SmoothedDirectionalMovementMinus[1]) - nz(SmoothedDirectionalMovementMinus[1]) / len + DirectionalMovementMinus

DIPlus = SmoothedDirectionalMovementPlus / SmoothedTrueRange * 100
DIMinus = SmoothedDirectionalMovementMinus / SmoothedTrueRange * 100
DX = math.abs(DIPlus - DIMinus) / (DIPlus + DIMinus) * 100
ADX = ta.sma(DX, len)


//diff_1 = math.abs(DIPlus - DIMinus)
diff_2 = math.abs(DIPlus-ADX)
diff_3 = math.abs(DIMinus - ADX)

long_diff = input(10, "Long Difference")
short_diff = input(10, "Short Difference")

buy_condition = diff_2 >=long_diff and diff_3 >=long_diff and (ADX < DIPlus and ADX > DIMinus)
sell_condition = diff_2 >=short_diff and diff_3 >=short_diff and (ADX > DIPlus and ADX < DIMinus)


if buy_condition
    strategy.entry("Long Entry", strategy.long, comment = "Long")
if sell_condition
    strategy.entry("Short Entry", strategy.short, comment = "Short")


// Copy below code to end of the desired strategy script
///////////////////////////////////////////////////////////////////////////////////////////////////////////////////////
//                                 monthly pnl performance  by Dr. Maurya @MAURYA_ALGO_TRADER                        //
///////////////////////////////////////////////////////////////////////////////////////////////////////////////////////
show_performance = input.bool(true, 'Show Monthly Monthly Performance ?', group='Monthly Performance')

dash_loc_mp = input("Bottom Right","Location"  ,options=["Top Right","Bottom Right","Top Left","Bottom Left", "Middle Right","Bottom Center"]  ,group='Monthly Performance', inline = "performance")

text_size_mp = input('Small',"Size"  ,options=["Tiny","Small","Normal","Large"]  ,group='Monthly Performance', inline = "performance")

bg_c = input.color( color.rgb(7, 226, 242, 38), "Background Color", group='Monthly Performance')

text_head_color = input.color( color.rgb(0,0,0), "Month/Year Heading Color", group='Monthly Performance')

tab_month_c = input.color( color.white, "Month PnL Data Color", group='Monthly Performance')

tab_year_c = input.color( color.rgb(0,0,0), "Year PnL Data Color", group='Monthly Performance')

border_c = input.color( color.white, "Table Border Color", group='Monthly Performance')


var table_position_mp = dash_loc_mp == 'Top Left' ? position.top_left :
  dash_loc_mp == 'Bottom Left' ? position.bottom_left :
  dash_loc_mp == 'Middle Right' ? position.middle_right :
  dash_loc_mp == 'Bottom Center' ? position.bottom_center :
  dash_loc_mp == 'Top Right' ? position.top_right : position.bottom_right

var table_text_size_mp = text_size_mp == 'Tiny' ? size.tiny :
  text_size_mp == 'Small' ? size.small :
  text_size_mp == 'Normal' ? size.normal : size.large

/////////////////
strategy.initial_capital =50000

/////////////////////////////////////////////

// var bool new_month = na
new_month = ta.change(month) //> 0 ? true : false
newest_month = new_month and strategy.closedtrades >= 1

// profit
only_profit = strategy.netprofit
initial_balance = strategy.initial_capital

// month number
var int month_number = na
month_number := (ta.valuewhen(newest_month, month(time), 0)) //and month(time) > 1 ? (ta.valuewhen(newest_month, month(time), 0) - 1) :  12 //1 to 12

//month_year
var int month_time = na
month_time := ta.valuewhen(newest_month, time, 0) - 2419200000


var int m_counter = 0
if newest_month
    m_counter += 1


// current month values
var bool new_year = na
new_year := ta.change(year)
curr_m_pnl = only_profit - nz(ta.valuewhen(newest_month, only_profit, 0), 0)
curr_m_number = newest_month ? ta.valuewhen(newest_month, month(time), 0) : month(time)
curr_y_pnl = (only_profit - nz(ta.valuewhen(new_year, only_profit, 0),0))


var float [] net_profit_array = array.new_float()
var int [] month_array = array.new_int()
var int [] month_time_array = array.new_int()


if newest_month
    array.push(net_profit_array, only_profit)
    array.push(month_array, month_number)
    array.push(month_time_array, month_time)


var float [] y_pnl_array = array.new_float()
var int [] y_number_array = array.new_int()
var int [] y_time_array = array.new_int()

newest_year = ta.change(year) and strategy.closedtrades >= 1
get_yearly_pnl = nz(ta.valuewhen(newest_year, strategy.netprofit, 0) - nz(ta.valuewhen(newest_year, strategy.netprofit, 1), 0), 0)
get_m_year = ta.valuewhen(newest_year, year(time), 1)
get_y_time = ta.valuewhen(newest_year, time, 0)

if newest_year
    array.push(y_pnl_array, get_yearly_pnl)
    array.push(y_number_array, get_m_year)
    array.push(y_time_array, get_y_time)
var float monthly_profit = na
var int column_month_number = na
var int row_month_time = na


var testTable = table.new(position = table_position_mp, columns = 14, rows = 40, bgcolor = bg_c, border_color = border_c, border_width = 1)
if barstate.islastconfirmedhistory and show_performance
    table.cell(table_id = testTable, column = 0, row = 0, text = "YEAR", text_color = text_head_color, text_size=table_text_size_mp)
    table.cell(table_id = testTable, column = 1, row = 0, text = "JAN", text_color = text_head_color, text_size=table_text_size_mp)
    table.cell(table_id = testTable, column = 2, row = 0, text = "FEB", text_color = text_head_color, text_size=table_text_size_mp)
    table.cell(table_id = testTable, column = 3, row = 0, text = "MAR", text_color = text_head_color, text_size=table_text_size_mp)
    table.cell(table_id = testTable, column = 4, row = 0, text = "APR", text_color = text_head_color, text_size=table_text_size_mp)
    table.cell(table_id = testTable, column = 5, row = 0, text = "MAY", text_color = text_head_color, text_size=table_text_size_mp)
    table.cell(table_id = testTable, column = 6, row = 0, text = "JUN", text_color = text_head_color, text_size=table_text_size_mp)
    table.cell(table_id = testTable, column = 7, row = 0, text = "JUL", text_color = text_head_color, text_size=table_text_size_mp)
    table.cell(table_id = testTable, column = 8, row = 0, text = "AUG", text_color = text_head_color, text_size=table_text_size_mp)
    table.cell(table_id = testTable, column = 9, row = 0, text = "SEP", text_color = text_head_color, text_size=table_text_size_mp)
    table.cell(table_id = testTable, column = 10, row = 0, text = "OCT", text_color = text_head_color, text_size=table_text_size_mp)
    table.cell(table_id = testTable, column = 11, row = 0, text = "NOV", text_color = text_head_color, text_size=table_text_size_mp)
    table.cell(table_id = testTable, column = 12, row = 0, text = "DEC", text_color =text_head_color, text_size=table_text_size_mp)
    table.cell(table_id = testTable, column = 13, row = 0, text = "YEAR P/L", text_color = text_head_color, text_size=table_text_size_mp)

    for i = 0 to (array.size(y_number_array) == 0 ? na : array.size(y_number_array) - 1)
        row_y = year(array.get(y_time_array, i)) - year(array.get(y_time_array, 0)) + 1
        table.cell(table_id = testTable, column = 13, row = row_y, text = str.tostring(array.get(y_pnl_array , i), "##.##") + '\n' + '(' + str.tostring(array.get(y_pnl_array , i)*100/initial_balance, "##.##") + ' %)', bgcolor = array.get(y_pnl_array , i) > 0 ? color.green : array.get(y_pnl_array , i) < 0 ? color.red : color.gray, text_color = tab_year_c, text_size=table_text_size_mp)
    curr_row_y = array.size(month_time_array) == 0 ? 1 : (year(array.get(month_time_array, array.size(month_time_array) - 1))) - (year(array.get(month_time_array, 0))) + 1
    table.cell(table_id = testTable, column = 13, row = curr_row_y, text = str.tostring(curr_y_pnl, "##.##") + '\n' + '(' + str.tostring(curr_y_pnl*100/initial_balance, "##.##") + ' %)', bgcolor = curr_y_pnl > 0 ? color.green : curr_y_pnl < 0 ? color.red : color.gray, text_color = tab_year_c, text_size=table_text_size_mp)


    for i = 0 to (array.size(net_profit_array) == 0 ? na : array.size(net_profit_array) - 1)
        monthly_profit := i > 0 ? ( array.get(net_profit_array, i) - array.get(net_profit_array, i - 1) ) : array.get(net_profit_array, i)
        column_month_number := month(array.get(month_time_array, i))
        row_month_time :=((year(array.get(month_time_array, i))) - year(array.get(month_time_array, 0)) ) + 1
        table.cell(table_id = testTable, column = column_month_number, row = row_month_time, text = str.tostring(monthly_profit, "##.##") + '\n' + '(' + str.tostring(monthly_profit*100/initial_balance, "##.##") + ' %)', bgcolor = monthly_profit > 0 ? color.green : monthly_profit < 0 ? color.red : color.gray, text_color = tab_month_c, text_size=table_text_size_mp)
        table.cell(table_id = testTable, column = 0, row =row_month_time, text = str.tostring(year(array.get(month_time_array, i)), "##.##"), text_color = text_head_color, text_size=table_text_size_mp)

    curr_row_m = array.size(month_time_array) == 0 ? 1 : (year(array.get(month_time_array, array.size(month_time_array) - 1))) - (year(array.get(month_time_array, 0))) + 1
    table.cell(table_id = testTable, column = curr_m_number, row = curr_row_m, text = str.tostring(curr_m_pnl, "##.##") + '\n' + '(' + str.tostring(curr_m_pnl*100/initial_balance, "##.##") + ' %)', bgcolor = curr_m_pnl > 0 ? color.green : curr_m_pnl < 0 ? color.red : color.gray, text_color = tab_month_c, text_size=table_text_size_mp)
    table.cell(table_id = testTable, column = 0, row =curr_row_m, text = str.tostring(year(time), "##.##"), text_color = text_head_color, text_size=table_text_size_mp)

//============================================================================================================================================================================