ईएमए मूविंग एवरेज और एमएसीडी इंडिकेटर पर आधारित बीटीसी ट्रेडिंग रणनीति
अवलोकन
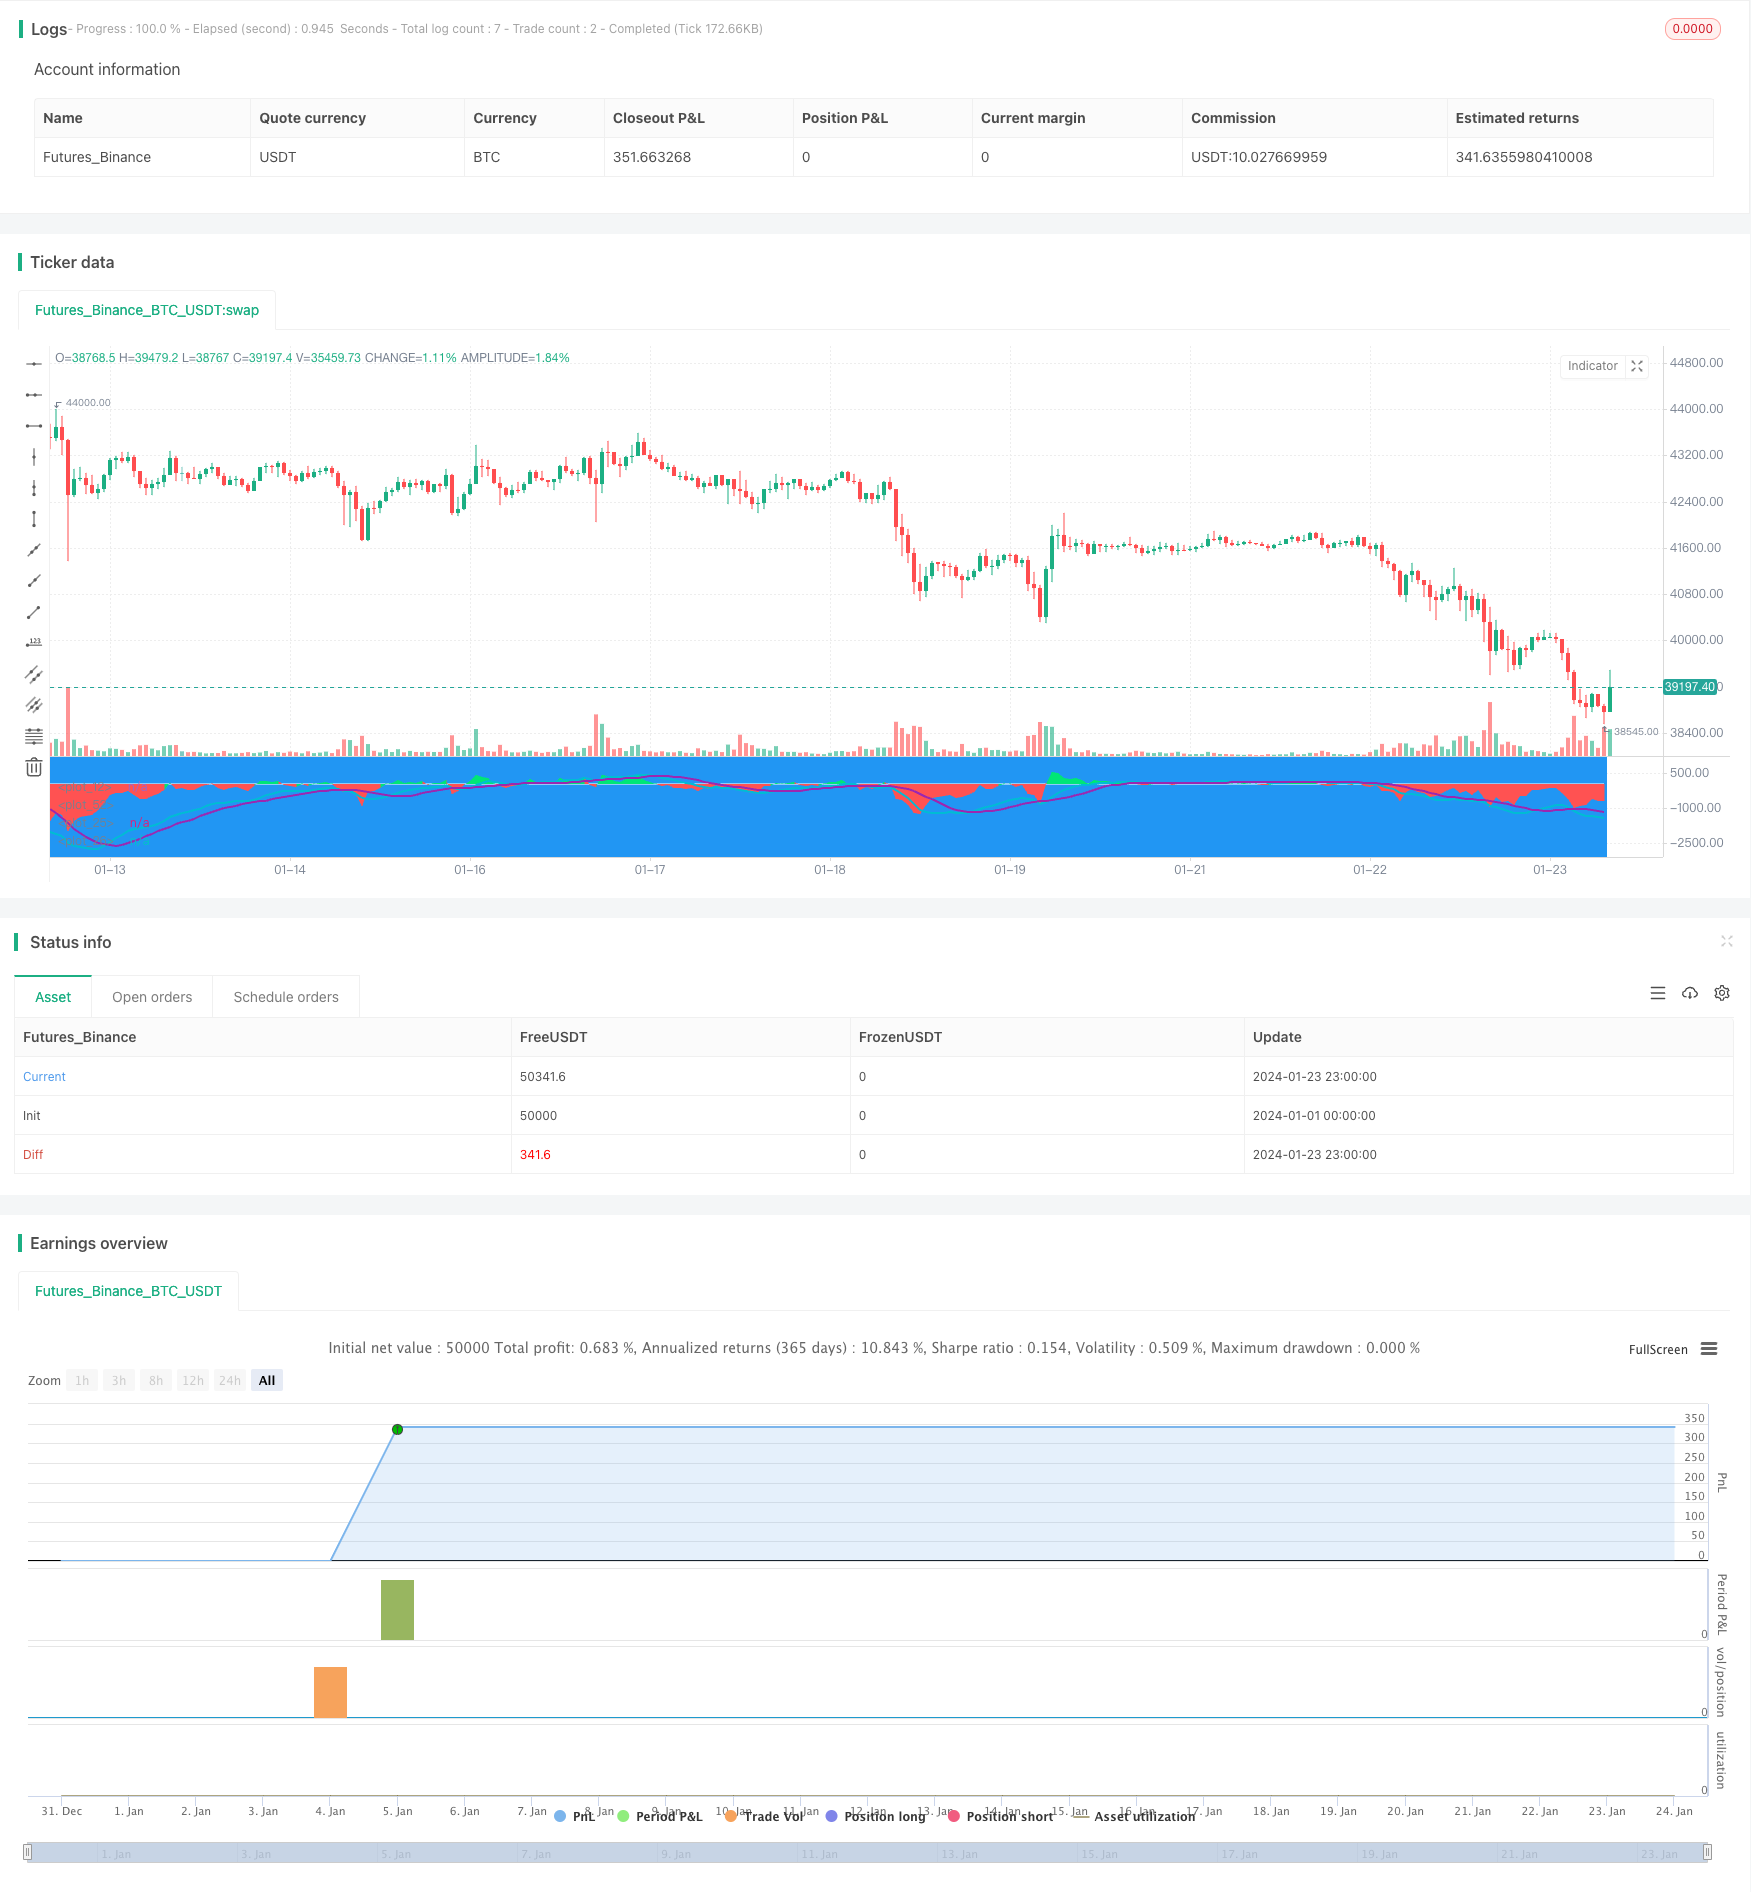
यह रणनीति ईएमए औसत रेखा और एमएसीडी सूचकांक पर आधारित एक मिश्रित रणनीति है, जो बीटीसी के लिए शॉर्ट-लाइन ट्रेडिंग के लिए है। यह ईएमए औसत रेखा और एमएसीडी के संकेतों को जोड़ती है, जो विशिष्ट परिस्थितियों में एक खरीद और बिक्री संकेत उत्पन्न करती है।
रणनीति सिद्धांत
जब अंतर नकारात्मक होता है और कम होता है, और MACD में एक खाली क्रॉस होता है, तो एक खरीद संकेत उत्पन्न होता है। जब अंतर सकारात्मक होता है और कम होता है, और MACD में एक मल्टीहेड क्रॉस होता है, तो एक बेचने का संकेत उत्पन्न होता है।
ईएमए औसत विचलन और एमएसीडी के संकेतों के संयोजन से, कुछ झूठे संकेतों को फ़िल्टर किया जा सकता है, जिससे संकेतों की विश्वसनीयता बढ़ जाती है।
श्रेष्ठता विश्लेषण
- मिश्रित संकेतकों का उपयोग, संकेत अधिक विश्वसनीय
- शॉर्ट-आवर्तन पैरामीटर के साथ सेट, शॉर्ट-लाइन ट्रेडिंग के लिए उपयुक्त
- स्टॉप लॉस और स्टॉप सेटिंग्स जो जोखिम को नियंत्रित करते हैं
जोखिम विश्लेषण
- जब बाजार में भारी उतार-चढ़ाव होता है, तो स्टॉप लॉस को तोड़ दिया जा सकता है
- विभिन्न बाजार स्थितियों के लिए अनुकूलित पैरामीटर की आवश्यकता
- विभिन्न मुद्राओं और विभिन्न एक्सचेंजों के परीक्षण की आवश्यकता
अनुकूलन दिशा
- ईएमए और एमएसीडी के लिए पैरामीटर का अनुकूलन करें ताकि यह बीटीसी के अस्थिर वातावरण के अनुरूप हो
- स्टॉक खोलने और स्टॉक कम करने की रणनीतियों में वृद्धि, पूंजी उपयोग दक्षता का अनुकूलन
- जोखिम को कम करने के लिए नुकसान को रोकने के तरीके जैसे कि चलती रोकथाम, कंपन रोकथाम
- विभिन्न एक्सचेंजों और विभिन्न मुद्राओं के प्रभाव का परीक्षण
संक्षेप
इस रणनीति में औसत रेखा और MACD दोनों संकेतकों के फायदे शामिल हैं। यह मिश्रित संकेतों का उपयोग करता है जो झूठे संकेतों को प्रभावी ढंग से फ़िल्टर कर सकता है। पैरामीटर को अनुकूलित करने और स्थिति खोलने की रणनीति के माध्यम से, स्थिर लाभ प्राप्त किया जा सकता है। लेकिन स्टॉप लॉस के जोखिम के लिए सतर्क रहने की भी आवश्यकता है। आगे परीक्षण और सुधार की आवश्यकता है।
/*backtest
start: 2024-01-01 00:00:00
end: 2024-01-24 00:00:00
period: 1h
basePeriod: 15m
exchanges: [{"eid":"Futures_Binance","currency":"BTC_USDT"}]
*/

//@version=3
strategy("EMA50Diff & MACD Strategy", overlay=false)
EMA = input(18, step=1)
MACDfast = input(12)
MACDslow = input(26)
EMADiffThreshold = input(8)
MACDThreshold = input(80)
TargetValidityThreshold = input(65, step=5)
Target = input(120, step=5)
StopLoss = input(650, step=5)
ema = ema(close, EMA)
hl = plot(0, color=white, linewidth=1)
diff = close - ema
clr = color(blue, transp=100)
if diff>0
    clr := lime
else
    if diff<0
        clr := red

fastMA = ema(close, MACDfast)
slowMA = ema(close, MACDslow)
macd = (fastMA - slowMA)*3
signal = sma(macd, 9)
plot(macd, color=aqua, linewidth=2)
plot(signal, color=purple, linewidth=2)

macdlong = macd<-MACDThreshold and signal<-MACDThreshold and crossover(macd, signal)
macdshort = macd>MACDThreshold and signal>MACDThreshold and crossunder(macd, signal)
position = 0.0
position := nz(strategy.position_size, 0.0)
long = (position < 0 and close < strategy.position_avg_price - TargetValidityThreshold and macdlong) or
     (position == 0.0 and diff < -EMADiffThreshold and diff > diff[1] and diff[1] < diff[2] and macdlong)

short = (position > 0 and close > strategy.position_avg_price + TargetValidityThreshold and macdshort) or
      (position == 0.0 and diff > EMADiffThreshold and diff < diff[1] and diff[1] > diff[2] and macdshort)
amount = (strategy.equity / close) //- ((strategy.equity / close / 10)%10)
bgclr = color(blue, transp=100) //#0c0c0c
if long
    strategy.entry("long", strategy.long, amount)
    bgclr := green
if short
    strategy.entry("short", strategy.short, amount)
    bgclr := maroon
bgcolor(bgclr, transp=20)
strategy.close("long", when=close>strategy.position_avg_price + Target)
strategy.close("short", when=close<strategy.position_avg_price - Target)
strategy.exit("STOPLOSS", "long", stop=strategy.position_avg_price - StopLoss)
strategy.exit("STOPLOSS", "short", stop=strategy.position_avg_price + StopLoss)
//plotshape(long, style=shape.labelup, location=location.bottom, color=green)
//plotshape(short, style=shape.labeldown, location=location.top, color=red)
pl = plot(diff, style=histogram, color=clr)
fill(hl, pl, color=clr)