गति विश्राम सूचक और 123 पैटर्न रणनीति

अवलोकन
यह रणनीति गतिशीलता और 123 के रूपों को जोड़कर एक समग्र ट्रेडिंग सिग्नल बनाती है, जिससे लाभ की संभावना बढ़ जाती है। इसमें गतिशीलता और 123 के रूप बाजार की अस्थिरता को ट्रैक करते हैं, अल्पकालिक रुझानों को पकड़ने के लिए आरएसआई मापदंडों को समायोजित करते हैं। 123 के रूपों में शेयरों की अल्पकालिक ऊंचाई और निम्नता का उपयोग करके ट्रेडिंग सिग्नल बनाते हैं। दोनों रणनीतियों का संयोजन रणनीति को विभिन्न बाजार स्थितियों में व्यापार प्रभावशीलता बनाए रखने में सक्षम बनाता है।
रणनीति सिद्धांत
123 रूप
123 प्रारूप तीन चरणों में विभाजित है, पहले चरण में शेयर की कीमत में लगातार दो दिन गिरावट आई, फिर दूसरे चरण में शेयर की कीमत में लगातार दो दिन की वृद्धि हुई, और अंत में तीसरे चरण में शेयर की कीमत में फिर से गिरावट आई। इस प्रारूप के आधार पर हम यह निर्धारित कर सकते हैं कि जब दूसरे चरण में शेयर की कीमत बढ़ जाती है तो मल्टीहेड पोजीशन बनाई जा सकती है, जबकि तीसरे चरण में शेयर की कीमत में गिरावट आने पर खाली सिर की स्थिति बनाई जा सकती है।
विशेष रूप से, जब समापन मूल्य लगातार दो दिनों तक गिरता है, तो यदि तीसरे दिन समापन मूल्य पिछले दिन के समापन मूल्य से अधिक है, जबकि 9 वें दिन स्टोचैस्टिक धीमा 50 से कम है, तो यह एक खरीद संकेत है; जब समापन मूल्य लगातार दो दिनों तक बढ़ता है, तो यदि तीसरे दिन समापन मूल्य पिछले दिन के समापन मूल्य से कम है, जबकि 9 वें दिन स्टोचैस्टिक फास्ट 50 से अधिक है, तो यह एक बिक्री संकेत है।
गतिशीलता का संकेत
गतिशीलता-चढ़ाव सूचकांक की निर्माण प्रक्रिया आरएसआई के समान है, मुख्य अंतर यह है कि गतिशीलता-चढ़ाव सूचकांक की अवधि परिवर्तनशील है। विशेष रूप से, इस सूचकांक की अवधि की लंबाई हाल के मूल्य उतार-चढ़ाव से प्रभावित है। कीमत में उतार-चढ़ाव जितना अधिक होता है, चक्र उतना ही छोटा होता है, जिससे सूचकांक अधिक संवेदनशील हो जाता है; जब कीमत स्थिर होती है, तो गलत रिपोर्टिंग की दर को कम करने के लिए चक्र लंबा होता है।
गतिशीलता के लिए तंजान सूचकांक की गणना सूत्र हैः
DMI = RSI(DTime)
其中:
DTime = 14 / X日收盘价标准差的10日均值
यह सूचक आरएसआई के समान परिभाषित दायरे के साथ है, जिसमें निम्न प्रकार के अधिक क्षेत्र हैं:
कई सिर वाला क्षेत्रः डीएमआई > 30
खाली सिर क्षेत्रः डीएमआई < 70
जब सूचकांक शून्य क्षेत्र से मल्टीहेड क्षेत्र में जाता है तो एक खरीद संकेत उत्पन्न होता है, और शून्य क्षेत्र से मल्टीहेड क्षेत्र में जाने पर एक बिक्री संकेत उत्पन्न होता है।
श्रेष्ठता विश्लेषण
-
123 फॉर्म सरल और प्रभावी है। यह फॉर्म शेयर की कीमतों की अल्पकालिक उलट विशेषताओं का उपयोग करता है, जो निम्न स्तर के नीचे खरीदा जाता है और निम्न स्तर के शीर्ष पर बेचा जाता है, और प्रवृत्ति के मध्य में व्यापार से बचा जाता है।
-
गतिशीलता के लिए, झांग चाउ सूचकांक अधिक संवेदनशील है। सूचकांक की गतिशीलता की विशेषताएं इसे बाजार के अनुकूल बनाने में सक्षम बनाती हैं, जो तीव्र उतार-चढ़ाव के दौरान समय पर मोड़ बिंदुओं को पकड़ती हैं।
-
दो रणनीतियाँ गलत सूचनाओं को प्रभावी ढंग से फ़िल्टर कर सकती हैं। 123 के रूप में संकेत उत्पन्न होने पर डीएमआई को बाजार की पृष्ठभूमि का आकलन करने के लिए संदर्भित किया जाता है, जिससे प्रवृत्ति में व्यापार से होने वाले नुकसान को कम किया जा सकता है।
-
दो रणनीतियों का लाभ उठाने के लिए DMI को फ़िल्टर के रूप में उपयोग करने के लिए अनुकूलित किया गया है, और 123 प्रारूपों के संयोजन से सिस्टम की स्थिरता में काफी सुधार हो सकता है।
जोखिम विश्लेषण
-
DMI और 123 प्रारूपों दोनों में गलत संकेत हो सकते हैं यदि कीमत केवल अल्पकालिक उतार-चढ़ाव के बिना बदलती है।
-
ट्रेडिंग की आवृत्ति बहुत अधिक हो सकती है। डीएमआई की आवर्ती प्रकृति बाजार के शोर के लिए अत्यधिक संवेदनशील है, और ट्रेडिंग की आवृत्ति को नियंत्रित करने के लिए पैरामीटर को ठीक से समायोजित करने की आवश्यकता है।
-
123-आकार में प्रवृत्ति के मध्यवर्ती अवसरों को याद किया जा सकता है। यह मुख्य रूप से अल्पकालिक रिवर्स को पकड़ता है और मध्य-लंबी प्रवृत्ति से लाभान्वित नहीं हो सकता है।
-
लेन-देन की संख्या को उचित रूप से सीमित करना आवश्यक है। अधिक लेनदेन से उच्च शुल्क और स्लाइड-पॉइंट लागतें हो सकती हैं।
अनुकूलन दिशा
-
गतिशीलता के लिए अनुकूलित करें। विभिन्न डीएमआई के आरएसआई मापदंडों का परीक्षण करें। ट्रेडिंग रेंज मापदंडों का परीक्षण करें और सबसे अच्छा संयोजन खोजें।
-
अनुकूलित 123 आकृति फ़िल्टरिंग शर्तें <unk> स्टोच सूचकांक के विभिन्न मापदंडों या अन्य फ़िल्टरिंग संकेतकों जैसे कि MACD का परीक्षण किया जा सकता है <unk>
-
बढ़ी हुई रोकथाम की व्यवस्था। उचित रोकथाम की सीमा को कम करने से व्यक्तिगत नुकसान कम हो सकता है।
-
स्थान प्रबंधन मॉड्यूल जोड़ना। जैसे कि निश्चित मात्रा का व्यापार, निश्चित पूंजी उपयोगिता व्यापार आदि से रणनीतिक जोखिम नियंत्रण को बेहतर बनाया जा सकता है।
संक्षेप
इस रणनीति को गतिशीलता के झांग झांग सूचकांक और 123 पैटर्न के संयोजन के माध्यम से दो कोणों से बाजार का आकलन करने के उद्देश्य से व्यापार संकेतों की प्रभावशीलता को बढ़ाने के लिए बनाया गया है। हालांकि, कोई भी एकल रणनीति बाजार में बदलाव के लिए पूरी तरह से अनुकूल नहीं हो सकती है। निवेशकों को जोखिम को नियंत्रित करने के लिए सावधानी बरतने की आवश्यकता होती है और फीडबैक और वास्तविक समय के परिणामों के आधार पर अनुकूलन मापदंडों को लगातार समायोजित करने की आवश्यकता होती है ताकि रणनीति को लगातार लाभदायक बनाया जा सके।
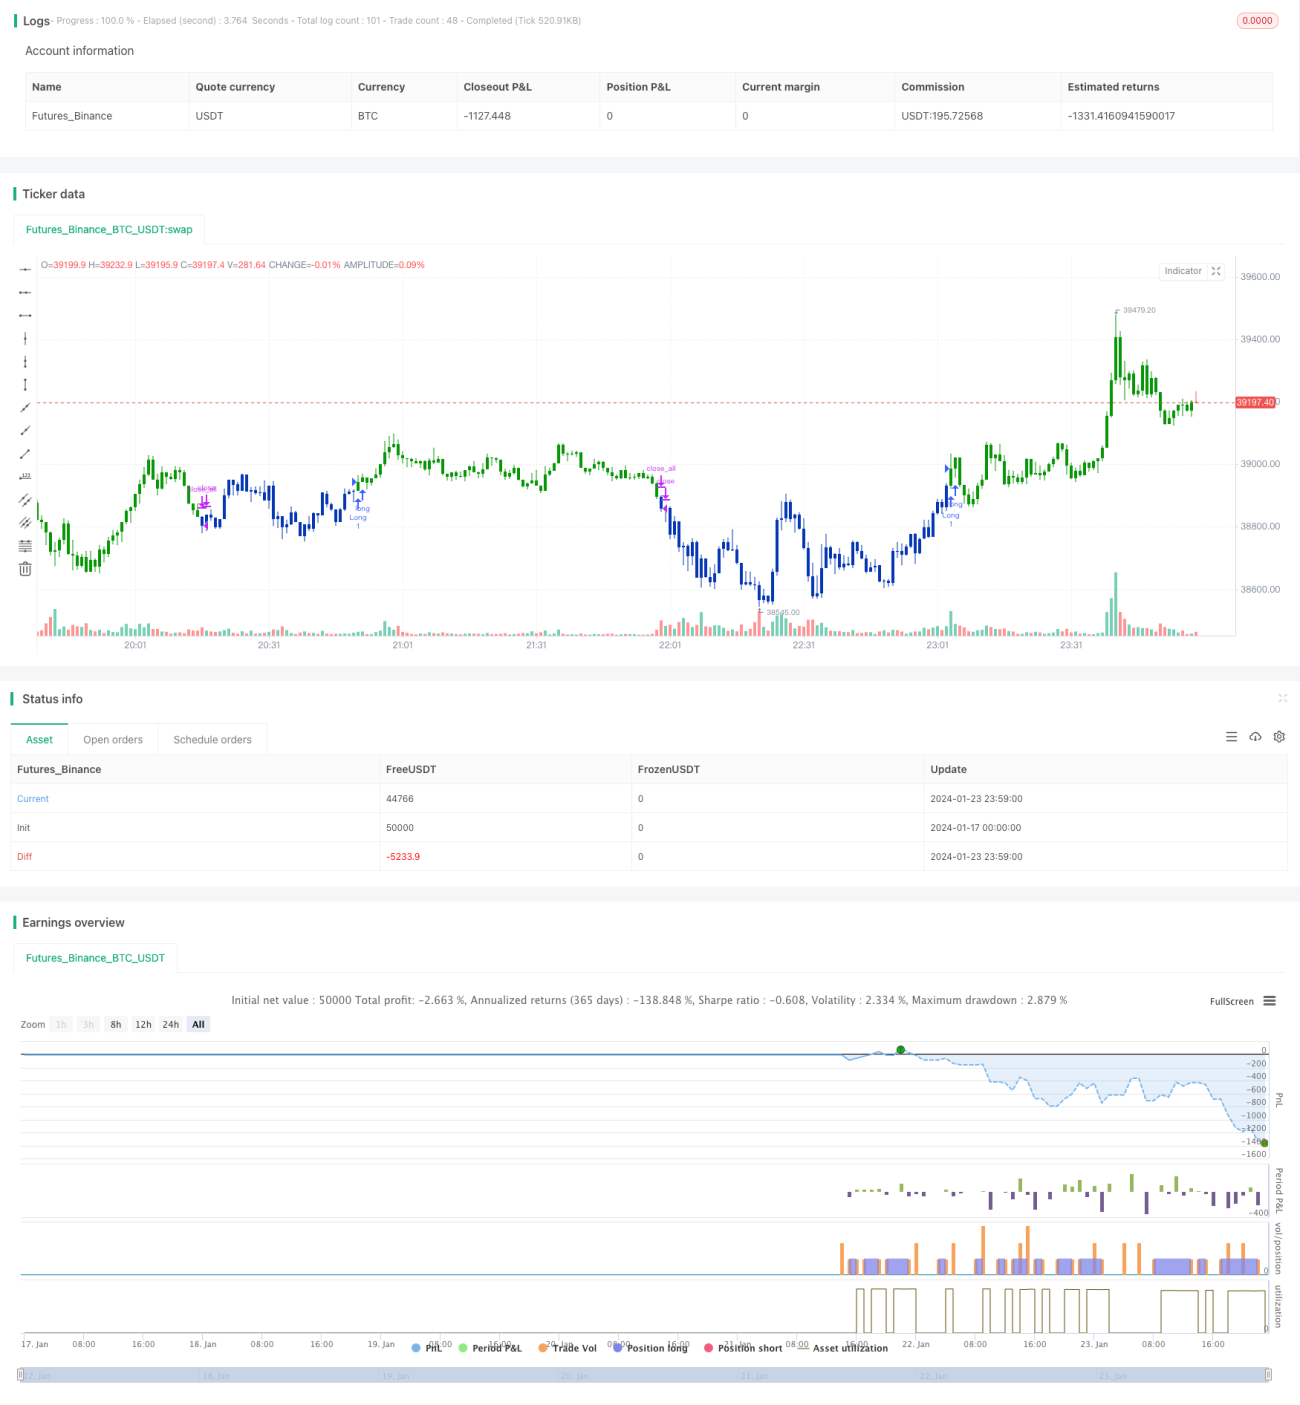
/*backtest
start: 2024-01-17 00:00:00
end: 2024-01-24 00:00:00
period: 1m
basePeriod: 1m
exchanges: [{"eid":"Futures_Binance","currency":"BTC_USDT"}]
*/

//@version=4
////////////////////////////////////////////////////////////
//  Copyright by HPotter v1.0 18/03/2020
// This is combo strategies for get a cumulative signal. - 1