ADX संकेतक पर आधारित कच्चे तेल की प्रवृत्ति अनुसरण रणनीति
अवलोकन
यह रणनीति केविन डेवी की मुफ्त तेल वायदा व्यापार रणनीति पर आधारित है। यह रणनीति ADX सूचकांक का उपयोग करके तेल बाजार के रुझानों का आकलन करती है, कीमत के ब्रेकआउट सिद्धांत के साथ मिलकर एक सरल और व्यावहारिक तेल स्वचालित व्यापार रणनीति को लागू करती है।
रणनीति सिद्धांत
- 14 चक्रों के लिए ADX सूचक की गणना करें
- जब ADX 10 से ऊपर होता है, तो यह एक प्रवृत्ति है
- यदि समापन मूल्य 65 के लाइन से पहले के समापन मूल्य से अधिक है, तो यह दर्शाता है कि कीमत टूट गई है, जो एक लंबी स्थिति संकेत है
- यदि समापन मूल्य 65 के लाइन से पहले के समापन मूल्य से कम है, तो यह संकेत देता है कि कीमत टूट गई है, जो एक छोटी स्थिति के लिए संकेत है
- लॉग इन के बाद रोक और रोक को सेट करें
यह रणनीति मुख्य रूप से ADX संकेतक पर निर्भर करती है जो रुझानों का आकलन करती है और रुझानों के मामले में एक निश्चित चक्र के मूल्य के ब्रेक के आधार पर एक व्यापारिक संकेत उत्पन्न करती है।
रणनीति का विश्लेषण
- ADX का उपयोग करके ट्रेंड का आकलन करें और ट्रेंड के अवसरों को याद न करें
- फिक्स्ड-साइक्लिक प्राइस ब्रेकआउट सिग्नल देता है, बेहतर रिटारगेटिंग प्रभाव
- कोड सहज, सरल, समझने और संशोधित करने में आसान है
- केविन डेवी ने कई वर्षों के लिए परीक्षण किया, गैर-वक्र अनुकूलन
रणनीतिक जोखिम विश्लेषण
- एडीएक्स मुख्य सूचक के रूप में, पैरामीटर चयन और ब्रेकआउट चक्र चयन के लिए संवेदनशील है
- एक निश्चित चक्र को तोड़ने के लिए कुछ अवसरों को याद किया जा सकता है
- स्टॉप लॉस स्टॉप को गलत तरीके से सेट करने से नुकसान बढ़ सकता है
- रीयल-टाइम प्रभाव और प्रतिक्रिया में अंतर की संभावना
रणनीति अनुकूलन दिशा
- ADX पैरामीटर और ब्रेकआउट चक्र का अनुकूलन करें
- बढ़ी हुई होल्डिंग गतिशील समायोजन
- फीडबैक परिणामों और परीक्षणों के आधार पर रणनीति में सुधार करना
- रणनीतिक अनुकूलन के लिए मशीन लर्निंग और डीप लर्निंग तकनीकों को शामिल करना
संक्षेप
कुल मिलाकर, यह एक बहुत ही व्यावहारिक कच्चे तेल व्यापार रणनीति है. यह ADX सूचक का उपयोग कर प्रवृत्ति का आकलन करने के लिए बहुत ही उचित है, मूल्य तोड़ने के सिद्धांत सरल और प्रभावी हैं, और यह अच्छी तरह से वापस आ गया है. केविन डेवी की सार्वजनिक रूप से मुफ्त रणनीति के रूप में, यह बहुत मजबूत व्यावहारिक विश्वसनीयता है. हालांकि रणनीति में सुधार की कुछ जगह है, यह शुरुआती और छोटे निवेशकों के लिए एक बहुत ही उपयुक्त विकल्प है।
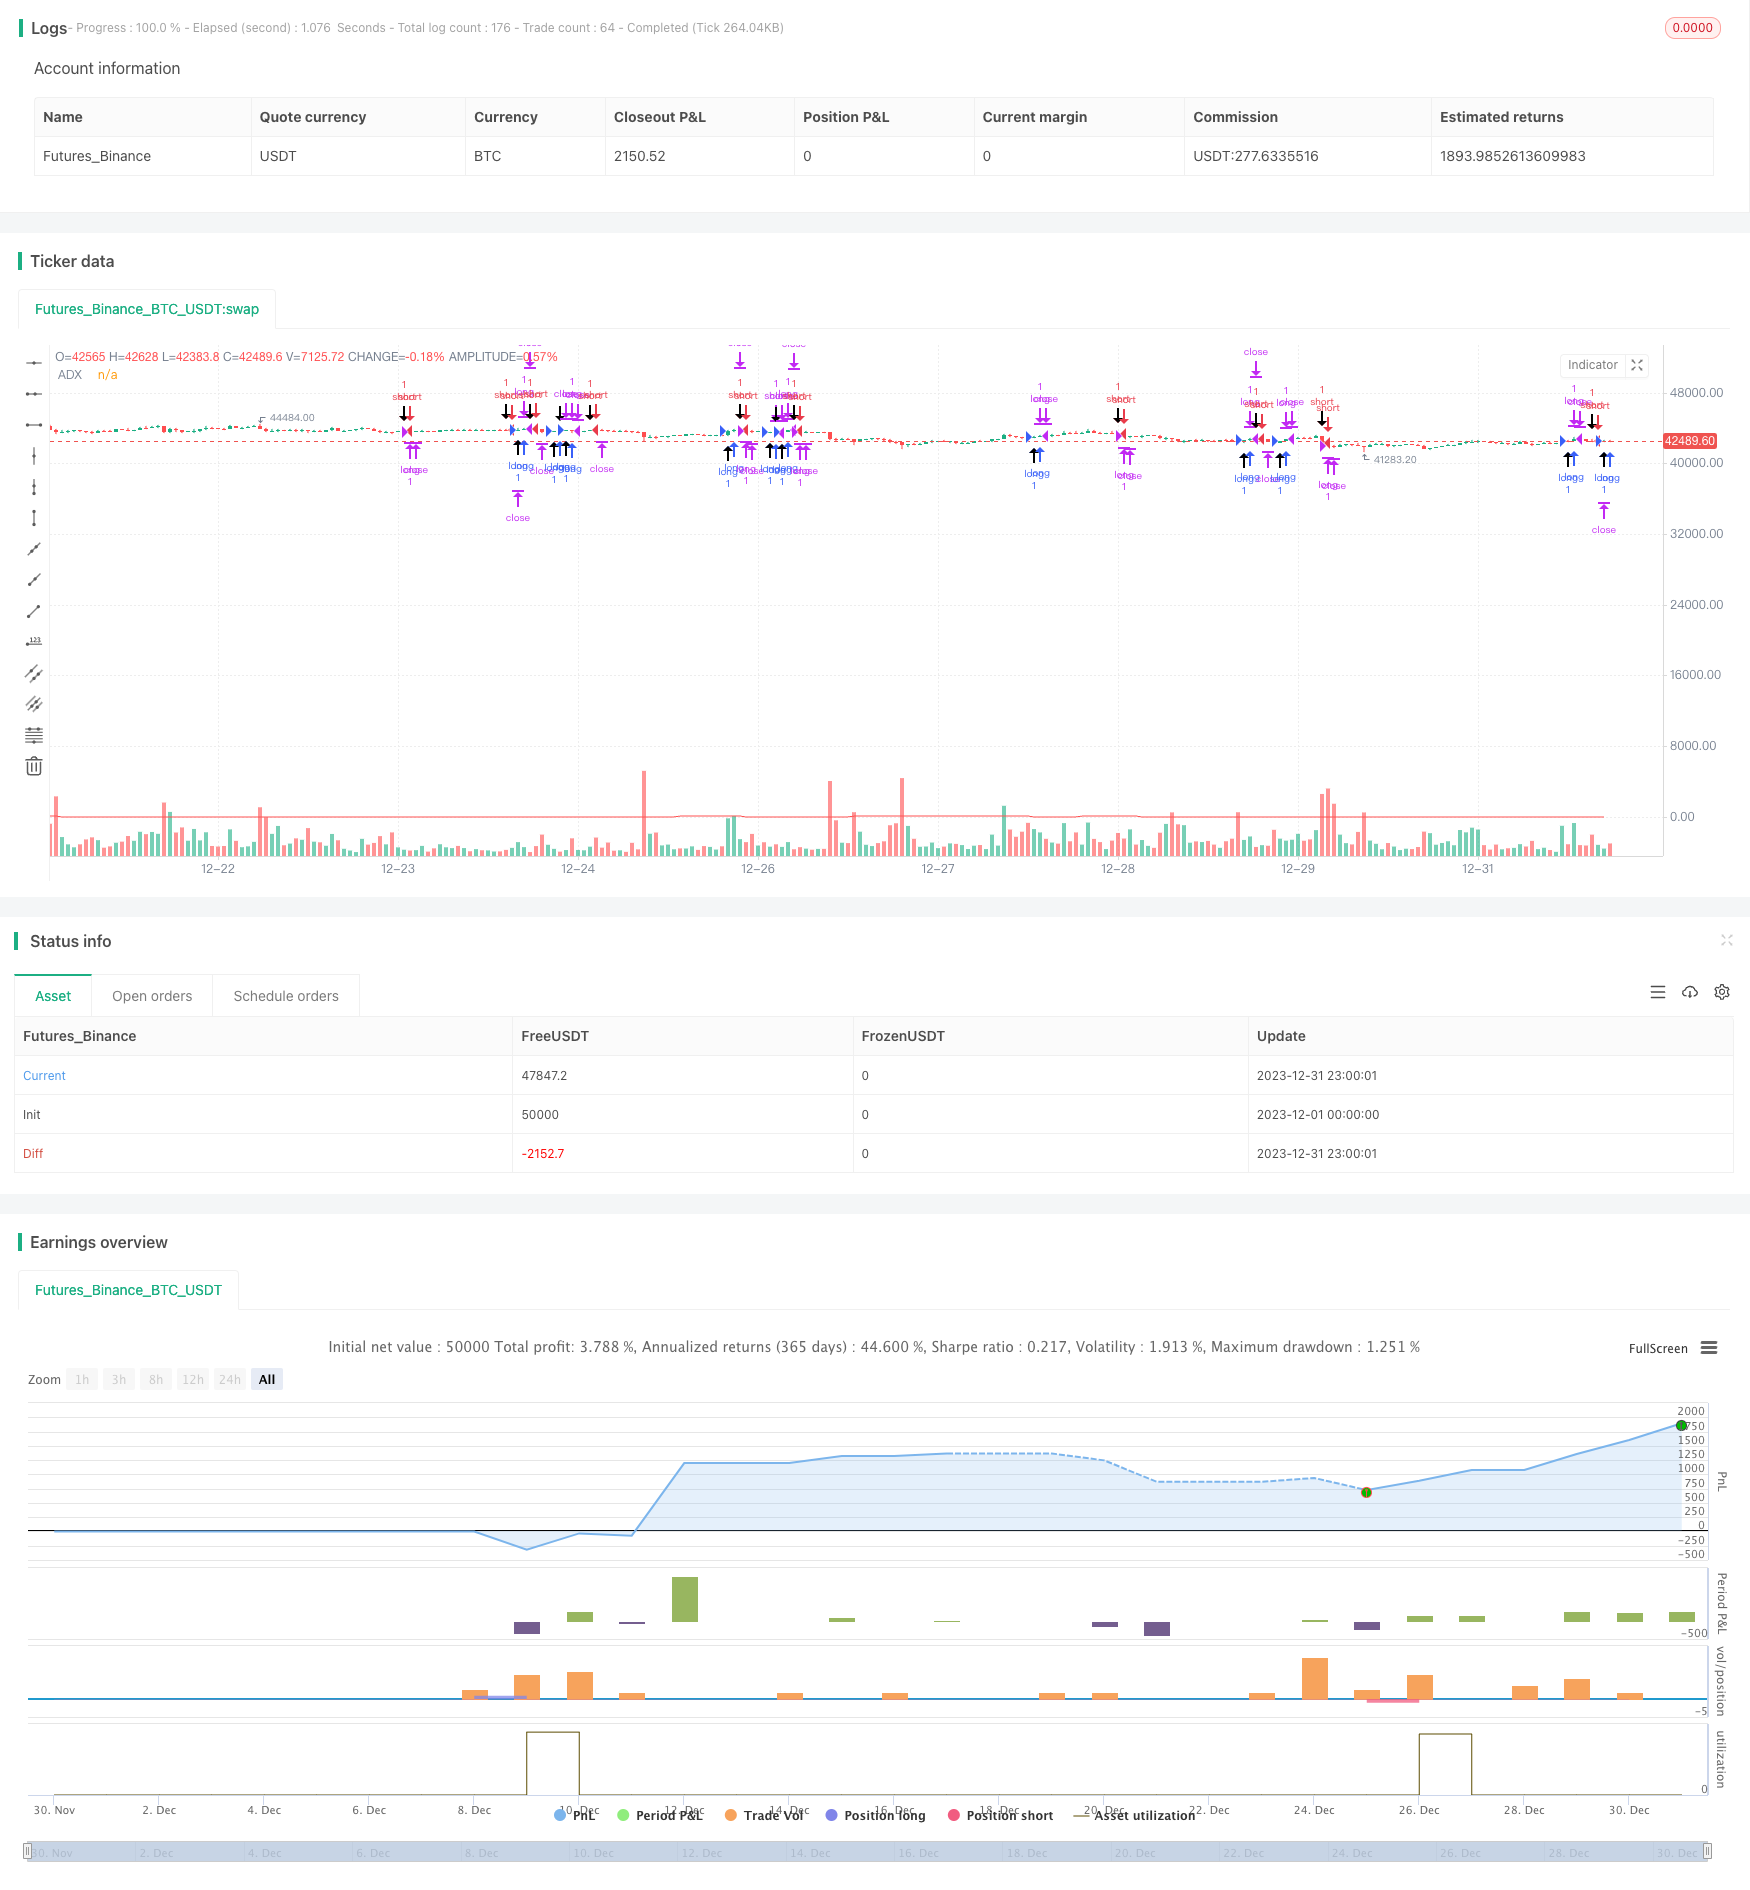
/*backtest
start: 2023-12-01 00:00:00
end: 2023-12-31 23:59:59
period: 1h
basePeriod: 15m
exchanges: [{"eid":"Futures_Binance","currency":"BTC_USDT"}]
*/

// Strategy idea coded from EasyLanguage to Pinescript
//@version=5
strategy("Kevin Davey Crude free crude oil strategy", shorttitle="CO Fut", format=format.price, precision=2, overlay = true, calc_on_every_tick = true)
adxlen = input(14, title="ADX Smoothing")
dilen = input(14, title="DI Length")
dirmov(len) =>
	up = ta.change(high)
	down = -ta.change(low)
	plusDM = na(up) ? na : (up > down and up > 0 ? up : 0)
	minusDM = na(down) ? na : (down > up and down > 0 ? down : 0)
	truerange = ta.rma(ta.tr, len)
	plus = fixnan(100 * ta.rma(plusDM, len) / truerange)
	minus = fixnan(100 * ta.rma(minusDM, len) / truerange)
	[plus, minus]
adx(dilen, adxlen) =>
	[plus, minus] = dirmov(dilen)
	sum = plus + minus
	adx = 100 * ta.rma(math.abs(plus - minus) / (sum == 0 ? 1 : sum), adxlen)
sig = adx(dilen, adxlen)
plot(sig, color=color.red, title="ADX")

buy = sig > 10 and (close - close[65]) > 0 and (close - close[65])[1] < 0
sell = sig > 10 and (close - close[65]) < 0 and (close - close[65])[1] > 0

plotshape(buy, style = shape.arrowup, location = location.belowbar,size = size.huge)
plotshape(sell, style = shape.arrowdown, location = location.abovebar,size = size.huge)

if buy
	strategy.entry("long", strategy.long)
if sell
	strategy.entry("short", strategy.short)

if strategy.position_size != 0
	strategy.exit("long", profit = 450, loss = 300)
	strategy.exit("short", profit = 450, loss = 300)


// GetTickValue() returns the currency value of the instrument's
// smallest possible price movement.
GetTickValue() =>
    syminfo.mintick * syminfo.pointvalue

// On the last historical bar, make a label to display the
// instrument's tick value
if barstate.islastconfirmedhistory
    label.new(x=bar_index + 1, y=close, style=label.style_label_left,
         color=color.black, textcolor=color.white, size=size.large,
         text=syminfo.ticker + " has a tick value of:\n" +
             syminfo.currency + " " + str.tostring(GetTickValue()))