डीएमआई और आरएसआई पर आधारित ट्रेंड फॉलोइंग रणनीति
संक्षिप्त विवरण
यह रणनीति एक अधिक पूर्ण ट्रेंड फॉलो ट्रेडिंग रणनीति को प्राप्त करने के लिए प्रवृत्ति की दिशा को निर्धारित करने वाले डीएमआई सूचक और ओवरबॉट को निर्धारित करने वाले आरएसआई सूचक को जोड़ती है। जब डीएमआई सूचक ट्रेंड दिखाता है और आरएसआई सूचक ओवरबॉट या ओवरबॉट दिखाता है, तो ओवरबॉट या ओवरबॉट दिखाता है। साथ ही लाभ को लॉक करने के लिए एक चलती रोक लगाई गई है।
रणनीतिक सिद्धांत
- डीएमआई सूचक का उपयोग कर प्रवृत्ति की दिशा का निर्धारण करना
- डीएमआई तीन घटकों से बना हैः + डीआई एक उछाल को दर्शाता है, - डीआई एक गिरावट को दर्शाता है, और एडीएक्स एक प्रवृत्ति की ताकत का आकलन करता है
- जब + डीआई> - डीआई ऊपर की ओर है, तो अधिक करें; जब - डीआई> + डीआई नीचे की ओर है, तो कम करें
- आरएसआई सूचकांक का उपयोग करके ओवरबॉट और ओवरसोल्ड का आकलन करें
- आरएसआई ओवरबॉट या ओवरसोल्ड का आकलन करने के लिए एक अवधि में औसत समापन वृद्धि और गिरावट की तुलना करता है
- RSI 30 से नीचे ओवरसोल्ड है, 70 से ऊपर ओवरबॉय है
- डीएमआई ट्रेंड की दिशा और आरएसआई ओवरबॉट और ओवरसोल्ड के साथ मिलकर बाजार की गति को बेहतर ढंग से पकड़ सकता है
- डीएमआई का मानना है कि जब आरएसआई ओवरसोल्ड होता है तो बेहतर होता है कि अधिक समय दिया जाए
- डीएमआई ने गिरावट का फैसला किया और आरएसआई ने ओवरबॉय किया
- मुनाफे को लॉक करने के लिए चलती रोक
ताकत विश्लेषण
यह एक अधिक परिपक्व और स्थिर प्रवृत्ति-अनुसरण रणनीति है, जिसके निम्नलिखित फायदे हैंः
- प्रवृत्ति के निर्णय के साथ-साथ ओवरबॉट और ओवरसोल्ड निर्णय के साथ, अस्थिर बाजारों में बार-बार व्यापार से बचें
- लोकप्रिय संकेतकों DMI और RSI का उपयोग करें, पैरामीटर का चयन करना आसान है, और अभ्यास में पर्याप्त सत्यापन
- मुनाफे को लॉक करने के लिए चलती रोक को सेट करना, कुछ हद तक रोक से बचा जा सकता है
- नियम स्पष्ट और समझने योग्य हैं, प्रक्रियाएं सरल हैं, और अभ्यास करना आसान है
जोखिम विश्लेषण
इस रणनीति के कुछ जोखिम भी हैं, जिनके बारे में ध्यान देने की आवश्यकता हैः
- डीएमआई और आरएसआई दोनों झूठे संकेतों के लिए अतिसंवेदनशील हैं, जिससे अनावश्यक नुकसान हो सकता है
- मोबाइल स्टॉप सेटिंग्स गलत हैं जो बहुत जल्दी या बहुत अधिक स्टॉप को रोक सकती हैं
- इस तरह की घटनाओं को फ़िल्टर करने में असमर्थता के कारण वे आसानी से फंस जाते हैं।
- ट्रेंड रणनीति का पालन करें, ट्रेंड रिवर्स होने पर समय पर स्टॉप लॉस न करें
अनुकूलन दिशा
इस रणनीति को निम्नलिखित पहलुओं से भी अनुकूलित किया जा सकता हैः
- अस्थिरता सूचकांक के साथ अस्थिरता फ़िल्टर
- झूठी घुसपैठ से बचने के लिए कैंडल आकृति के साथ संयोजन
- महत्वपूर्ण समर्थन प्रतिरोध स्थानों के पास उचित स्टॉप लॉस सीमा सेट करें
- मशीन सीखने के मॉडल को ट्रेंड का आकलन करने के लिए जोड़ें
- गतिशील अनुकूलन डीएमआई और आरएसआई के लिए पैरामीटर
सारांश
यह रणनीति समग्र रूप से एक अधिक स्थिर और व्यावहारिक प्रवृत्ति का पालन करने वाली रणनीति है, जो डीएमआई के माध्यम से प्रवृत्ति की दिशा का निर्धारण करती है, आरएसआई ओवरबॉय और ओवरसोल का निर्धारण करती है, जिससे मध्य-लंबी रेखा के व्यापार के अवसरों को पकड़ लिया जाता है। साथ ही, लाभ को लॉक करने के लिए चलती रोकथाम की स्थापना की जाती है। इस रणनीति के पैरामीटर का चयन सरल है, व्यापार के नियम स्पष्ट हैं, और इसे लागू करना आसान है। लेकिन यह भी है कि कुछ पैरामीटर और मॉडल के अनुकूलन के माध्यम से, इस रणनीति के प्रभाव को बेहतर बनाया जा सकता है।
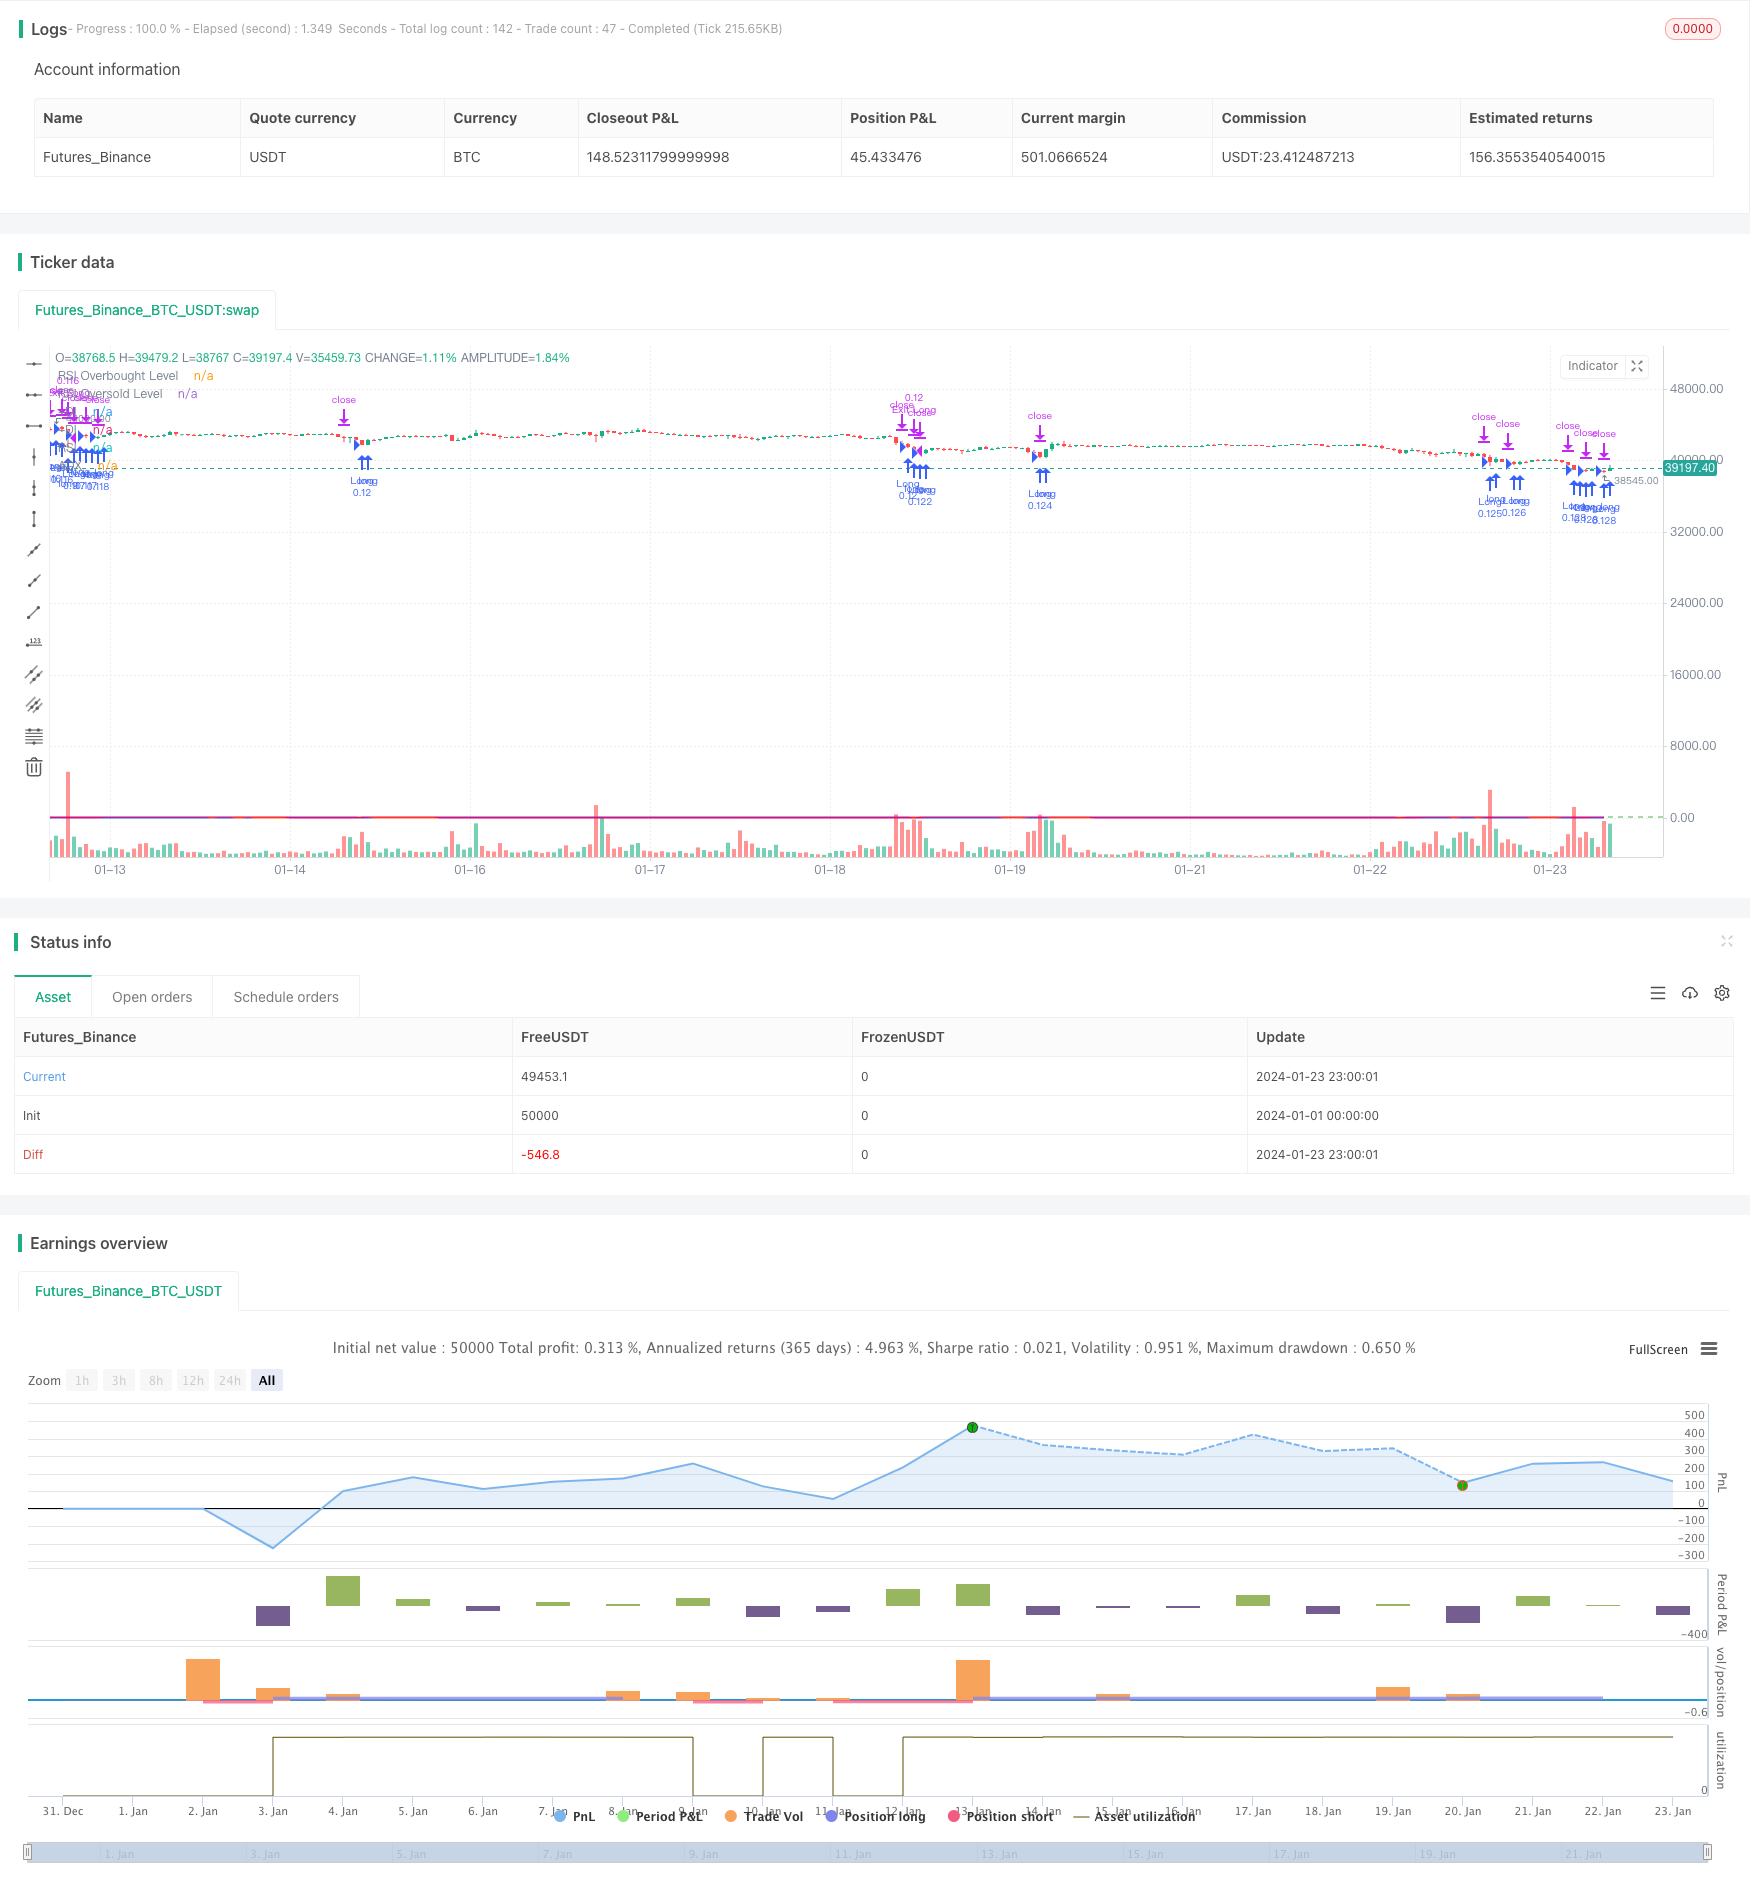
/*backtest
start: 2024-01-01 00:00:00
end: 2024-01-24 00:00:00
period: 1h
basePeriod: 15m
exchanges: [{"eid":"Futures_Binance","currency":"BTC_USDT"}]
*/

// This Pine Script™ code is subject to the terms of the Mozilla Public License 2.0 at https://mozilla.org/MPL/2.0/
// © YingYangJPN

//@version=5
strategy("DMI and RSI Strategy", overlay=true, initial_capital=10000, default_qty_type=strategy.percent_of_equity, default_qty_value=10)

// DMI indikatörünü tanımlayalım
lensig = input.int(14, title="ADX Smoothing", minval=1, maxval=50)
len = input.int(14, minval=1, title="DI Length")
up = ta.change(high)
down = -ta.change(low)
plusDM = na(up) ? na : (up > down and up > 0 ? up : 0)
minusDM = na(down) ? na : (down > up and down > 0 ? down : 0)
trur = ta.rma(ta.tr, len)
plus = fixnan(100 * ta.rma(plusDM, len) / trur)
minus = fixnan(100 * ta.rma(minusDM, len) / trur)
sum = plus + minus
adx = 100 * ta.rma(math.abs(plus - minus) / (sum == 0 ? 1 : sum), lensig)
trailing_stop_loss_factor = input.float(0.50, "Trailing Stop Loss Factor", step = 0.01)

// RSI indikatörünü tanımlayalım
rsiLength = input.int(14, minval=1, title="RSI Length")
rsiSource = input(close, title="RSI Source")
rsiOverbought = input.int(70, title="RSI Overbought Level")
rsiOversold = input.int(30, title="RSI Oversold Level")
rsiValue = ta.rsi(rsiSource, rsiLength)

// Uzun pozisyon açma koşullarını tanımlayalım
longCondition1 = rsiValue < rsiOversold // RSI oversold seviyesinin altındaysa
longCondition2 = adx > 20 // ADX 20'den büyükse
longCondition3 = minus > plus

// Kısa pozisyon açma koşullarını tanımlayalım
shortCondition1 = rsiValue > rsiOverbought // RSI overbought seviyesinin üstündeyse
shortCondition2 = adx > 20 // ADX 20'den büyükse
shortCondition3 = plus > minus

// Uzun pozisyon açalım
if longCondition1 and longCondition2 and longCondition3
    strategy.entry("Long", strategy.long)


// Kısa pozisyon açalım
if shortCondition1 and shortCondition2 and shortCondition3
    strategy.entry("Short", strategy.short)

// Trailing Stop Loss
longTrailingStopLoss = strategy.position_avg_price * (1 - trailing_stop_loss_factor / 100)
shortTrailingStopLoss = strategy.position_avg_price * (1 + trailing_stop_loss_factor / 100)
if strategy.position_size > 0
    strategy.exit("Exit Long", "Long", stop  = longTrailingStopLoss)
if strategy.position_size < 0
    strategy.exit("Exit Short", "Short", stop = shortTrailingStopLoss)

// DMI ve RSI indikatörlerini grafiğe çizelim
plot(adx, color=#F50057, title="ADX")
plot(plus, color=#2962FF, title="+DI")
plot(minus, color=#FF6D00, title="-DI")
plot(rsiValue, color=#9C27B0, title="RSI")
hline(rsiOverbought, title="RSI Overbought Level", color=#E91E63, linestyle=hline.style_dashed)
hline(rsiOversold, title="RSI Oversold Level", color=#4CAF50, linestyle=hline.style_dashed)