स्टोकेस्टिक संकेतक पर आधारित चक्रीय विकल्प ट्रेडिंग रणनीति
अवलोकन
इस रणनीति को स्टोचैस्टिक सूचक पर आधारित आवधिक विकल्प ट्रेडिंग रणनीति कहा जाता है, जो स्टोचैस्टिक आघात सूचक का उपयोग करता है, जो संभावित प्रवेश और विकल्प ट्रेडों के बाहर निकलने के बिंदुओं की पहचान करता है। यह रणनीति विशेष रूप से विकल्प ट्रेडिंग के लिए है, जो व्यापार के अवसरों की पहचान करने के लिए है।
रणनीति सिद्धांत
यह रणनीति 14 चक्रों की स्टोकेस्टिक %K लाइन और 3 चक्रों की सरल चलती औसत का उपयोग करके स्टोकेस्टिक %D लाइन को रेखांकित करती है। %K लाइन को एक bullish संकेत के रूप में माना जाता है जब यह कम से%D लाइन को तोड़ता है; %K लाइन को एक bullish संकेत के रूप में माना जाता है जब यह उच्च से%D लाइन को तोड़ता है। विशिष्ट प्रवेश और निकास की शर्तें इस प्रकार हैंः
मल्टी हेड इनपुटः जब% K लाइन 20% से नीचे की स्तर से% D लाइन को तोड़ती है तो अधिक करें मल्टी हेड एग्जिटः जब %K लाइन 80% से अधिक स्तर से %D लाइन को तोड़ती है तो स्थिति को समतल करती है खाली सिर प्रवेशः जब %K लाइन 80 से ऊपर के स्तर से %D लाइन को तोड़ती है तो खाली करें खाली सिर से बाहर निकलेंः जब% K लाइन 20% से नीचे की सीमा से% D लाइन को तोड़ती है तो स्थिति को समतल करें
रणनीतिक लाभ
- स्टोचैस्टिक सूचक का उपयोग करके ओवरबॉय और ओवरसोल्ड क्षेत्रों की पहचान करें, और बाजार के शीर्ष पर ओवरबॉडी और निचले स्तर पर ओवरबॉडी से बचें
- संकेतक मापदंडों के अनुकूलन के साथ, ट्रेडिंग सिग्नल की गुणवत्ता में सुधार
- अनुकूलित प्रवेश और बाहर निकलने की शर्तें, स्थिति प्रबंधन का अनुकूलन
- ऑप्शन ट्रेडिंग के लिए उपयोग किया जा सकता है ताकि धन का उपयोग अधिक कुशल हो सके
जोखिम विश्लेषण
- स्टोचैस्टिक संकेतक झूठे संकेतों के लिए अतिसंवेदनशील होते हैं और अन्य संकेतक के साथ संयोजन में फ़िल्टर किए जाते हैं
- फिक्स्ड पैरामीटर सेटिंग्स कुछ ट्रेडिंग अवसरों को याद कर सकते हैं
- एकल स्थिति को नियंत्रित करने के लिए निकासी का विस्तार हो सकता है
- शेयर मूलभूतताओं और मैक्रो परिवेश में बदलाव पर ध्यान दें
रणनीति अनुकूलन दिशा
- झूठे संकेतों को फ़िल्टर करने के लिए चलती औसत जैसे संकेतक
- विभिन्न पैरामीटर संयोजनों का परीक्षण करें, पैरामीटर सेटिंग्स का अनुकूलन करें
- गलत संकेतों को कम करने के लिए ब्रेकआउट मापदंड बढ़ाएं
- एकल हानि को नियंत्रित करने के लिए स्टॉप लॉस को अनुकूलित करें
संक्षेप
इस रणनीति का उपयोग स्टोचैस्टिक सूचक के ओवरबॉय ओवरसोल सिद्धांत का उपयोग संभावित प्रवेश समय की पहचान करने के लिए किया जाता है। पारंपरिक प्रवृत्ति ट्रैकिंग रणनीति की तुलना में, यह बाजार के मोड़ बिंदुओं पर अधिक बाजार को पकड़ सकता है। पैरामीटर अनुकूलन, सिग्नल फ़िल्टरिंग आदि के माध्यम से रणनीति की स्थिरता को और बढ़ाया जा सकता है। इस रणनीति का उपयोग विकल्पों के व्यापार के लिए किया जा सकता है, जो जोखिम को नियंत्रित करने के आधार पर उच्च रिटर्न प्राप्त करता है।
/*backtest
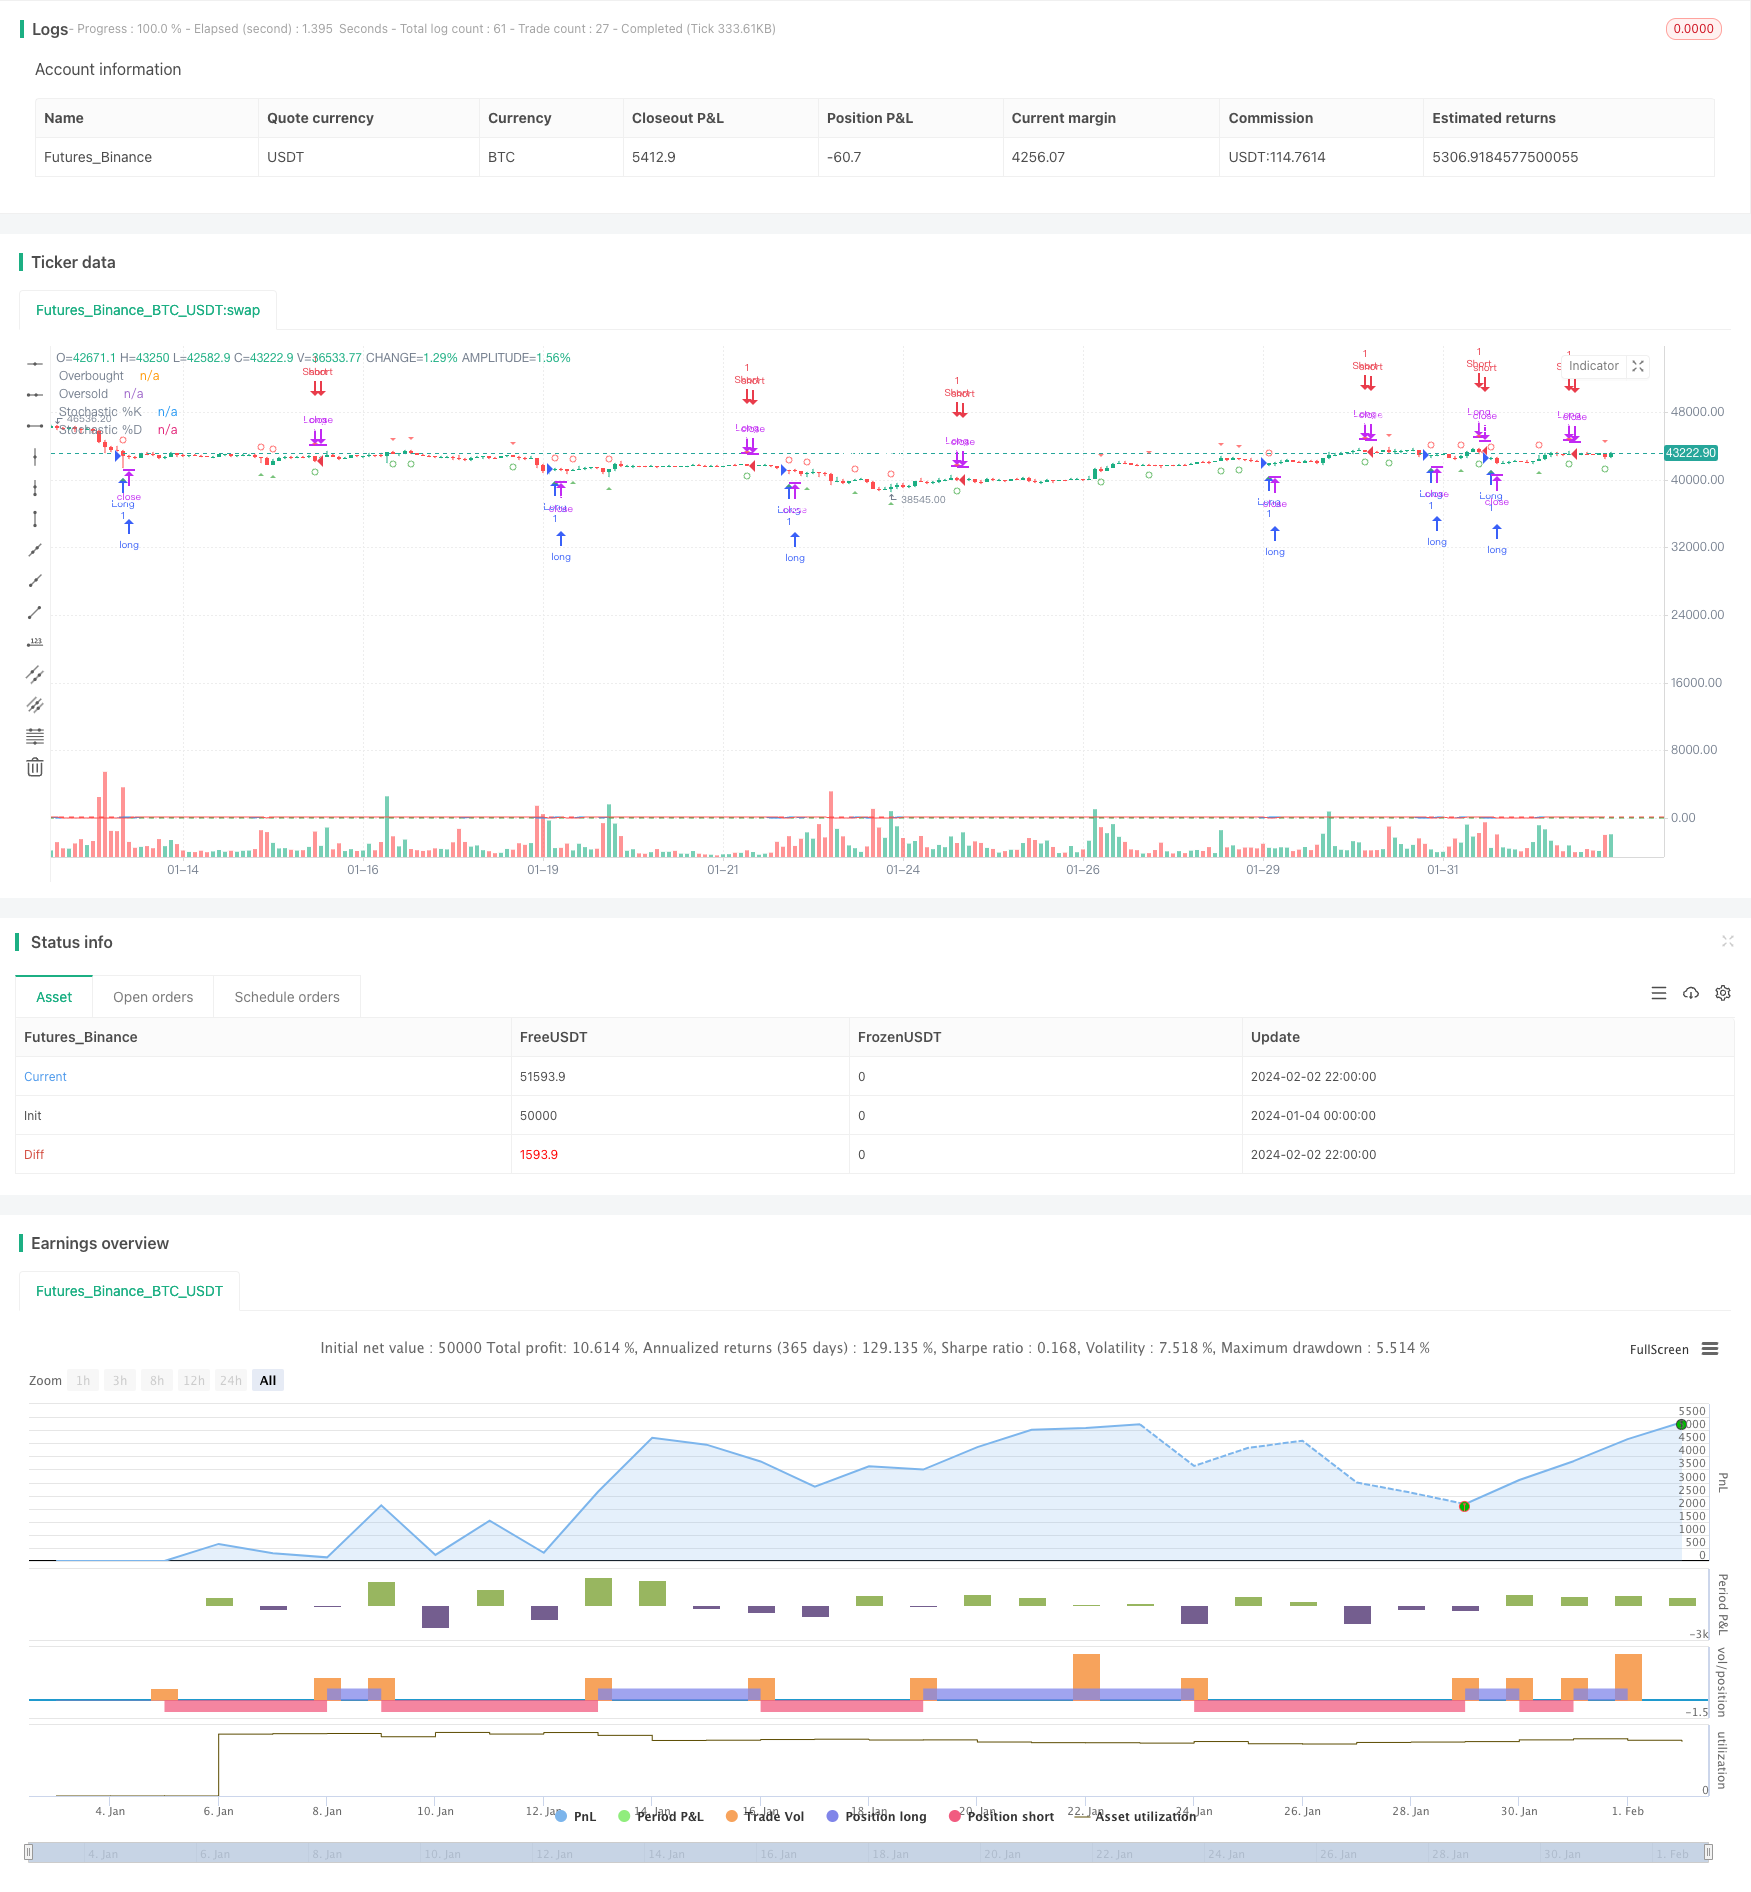
start: 2024-01-04 00:00:00
end: 2024-02-03 00:00:00
period: 2h
basePeriod: 15m
exchanges: [{"eid":"Futures_Binance","currency":"BTC_USDT"}]
*/
//@version=5
strategy("Stochastic Weekly Options Strategy", overlay=true, shorttitle="WOS")
// Stochastic settings
K = ta.stoch(close, high, low, 14)
D = ta.sma(K, 3)
// Entry and exit conditions
longEntry = ta.crossover(K, 20)
longExit = ta.crossunder(K, 80)
shortEntry = ta.crossunder(K, 80)
shortExit = ta.crossover(K, 20)
// Strategy execution
strategy.entry("Long", strategy.long, when=longEntry)
strategy.close("Long", when=longExit)
strategy.entry("Short", strategy.short, when=shortEntry)
strategy.close("Short", when=shortExit)
// Alert conditions
alertcondition(longEntry, title="Long Entry Alert", message="Stochastic bullish crossover! Consider buying a call option.")
alertcondition(longExit, title="Long Exit Alert", message="Stochastic bearish crossover! Consider selling the call option.")
alertcondition(shortEntry, title="Short Entry Alert", message="Stochastic bearish crossover! Consider buying a put option.")
alertcondition(shortExit, title="Short Exit Alert", message="Stochastic bullish crossover! Consider selling the put option.")
// Plotting shapes for buy and sell signals
plotshape(longEntry, title="Calls Entry Label", color=color.new(color.green, 25),
textcolor=color.white, style=shape.triangleup, text="Calls", location=location.belowbar, size=size.small)
plotshape(longExit, title="Calls Exit Label", color=color.new(color.green, 25),
textcolor=color.white, style=shape.circle, text="Exit", location=location.belowbar, size=size.small)
plotshape(shortEntry, title="Puts Entry Label", color=color.new(color.red, 25),
textcolor=color.white, style=shape.triangledown, text="Puts", location=location.abovebar, size=size.small)
plotshape(shortExit, title="Puts Exit Label", color=color.new(color.red, 25),
textcolor=color.white, style=shape.circle, text="Exit", location=location.abovebar, size=size.small)
// Plotting
plot(K, color=color.blue, title="Stochastic %K")
plot(D, color=color.red, title="Stochastic %D")
hline(80, "Overbought", color=color.red)
hline(20, "Oversold", color=color.green)