
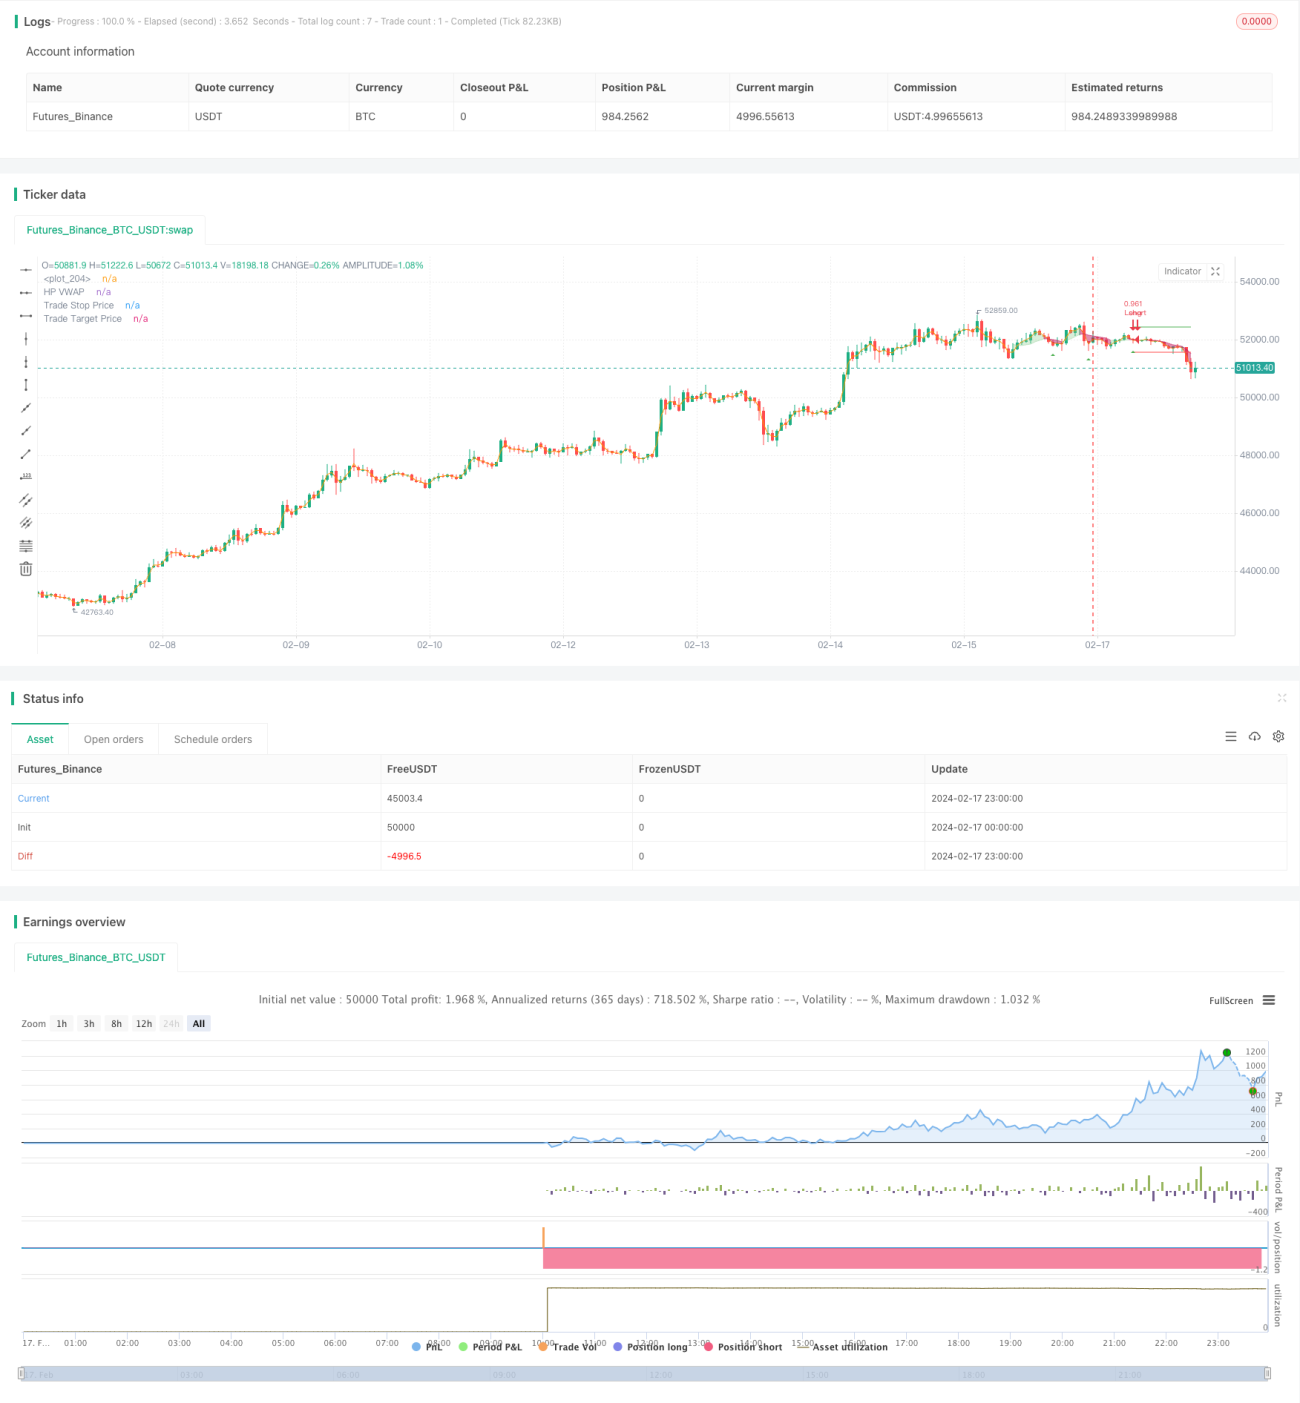
यह रणनीति होड्रिक-प्रेस्कॉट (एचपी) फ़िल्टर का उपयोग करके कीमतों को चिकना करती है, कीमतों की प्रवृत्ति रेखा को निकालती है। फिर उपयोगकर्ता द्वारा परिभाषित समय सीमा के आधार पर एक कस्टम भारित औसत मूल्य (वीडब्ल्यूएपी) की गणना करती है। जब कीमतें ट्रेंड लाइन से ऊपर होती हैं, तो अधिक होती हैं, और जब यह कम होती है, तो शून्य होती हैं। साथ ही एटीआर स्टॉप लॉस के संयोजन से यह सुनिश्चित होता है कि ट्रेडिंग जोखिम नियंत्रित हो।
एचपी फ़िल्टर का उपयोग करके मूल्य की प्रवृत्ति रेखाओं को निकालने के लिए। एचपी फ़िल्टर मूल्य के दीर्घकालिक प्रवृत्ति घटकों को निकालने के लिए एक अनुकूलन विधि का उपयोग करता है, जो अल्पकालिक उतार-चढ़ाव के हस्तक्षेप को हटा देता है।
VWAP की गणना उपयोगकर्ता द्वारा अनुकूलित समय सीमा के आधार पर की जाती है। VWAP विभिन्न अवधियों में औसत कीमतों को अधिक सटीक रूप से दर्शाता है।
जब कीमत एचपी ट्रेंड लाइन से ऊपर होती है, तो बहु शर्त को पूरा किया जाता है; जब कीमत एचपी ट्रेंड लाइन से नीचे होती है, तो रिक्त शर्त को पूरा किया जाता है। इस तरह से नीचे से ऊपर की दर या ऊपर से नीचे की दर को पकड़ना संभव है।
एटीआर रोकथाम उचित जोखिम लेने के साथ-साथ अत्यधिक नुकसान से बचने के लिए है।
एचपी फिल्टर का उपयोग करके मूल्य प्रवृत्ति को निकालने के लिए, एमए जैसे संकेतकों की तुलना में अधिक चिकनी, अल्पकालिक मूल्य उतार-चढ़ाव से भ्रामक होने से बचें।
अनुकूलित VWAP चक्र, अधिक लचीला बाजार चक्र परिवर्तनों के लिए अनुकूलित
प्रवृत्ति की दिशा के अनुसार व्यापार, प्रवृत्ति व्यापार विचारधारा के अनुरूप, जीत की उच्च दर।
एटीआर स्टॉप लॉस नियंत्रण एकल नुकसान, अत्यधिक नुकसान से बचें।
कई मापदंडों को समायोजित किया जा सकता है और विभिन्न बाजारों के लिए अनुकूलित किया जा सकता है।
बार-बार मारा जा सकता है। उचित रूप से क्षतिग्रस्त सीमा में छूट दी जा सकती है।
रुझान के अंत में क्लाइंट राउ रेस्पॉन्स में अक्सर रिवर्स शेड्यूल की जांच की जाती है, जिससे रणनीति को बंद कर दिया जाता है। रुझान के अंत में अन्य संकेतकों के साथ संयोजन में, समय पर स्थिति को स्पष्ट करना चाहिए।
VWAP चक्र की अनुचित सेटिंग अधिक प्रभावी व्यापार के अवसरों को याद कर सकती है। VWAP चक्र को ट्रेंड इंडिकेटर की गतिशीलता के साथ समायोजित किया जाना चाहिए।
HP फ़िल्टर पैरामीटर λ को चिकनाई की ताकत को समायोजित किया जा सकता है. λ मूल्य बड़ा होता है जब प्रवृत्ति रेखा अधिक चिकनी होती है, जो लंबी रेखा की प्रवृत्ति को पकड़ने के लिए अधिक अनुकूल होती है; λ मूल्य घंटे मूल्य परिवर्तन के प्रति अधिक संवेदनशील होता है, जो मध्यम और छोटी रेखा के अवसरों को पकड़ने के लिए अधिक उपयुक्त होता है।
एटीआर गुणांक रोकथाम रेंज को समायोजित कर सकता है। यहλ पैरामीटर अनुकूलन के साथ संगत है, जब λ मान बड़ा होता है तो रोकथाम रेंज को उचित रूप से बढ़ाया जाता है; छोटे λ मान अधिक लाभ को लॉक करने के लिए रोकथाम रेंज को छोटा कर सकते हैं।
रिस्क-रिटर्न अनुपात ((R: R) सीधे लाभ-हानि अनुपात को प्रभावित करता है। विभिन्न गुणांक स्थितियों में वापस लेने के नियंत्रण और लाभप्रदता का परीक्षण किया जा सकता है।
इस रणनीति में समग्र रूप से प्रवृत्ति का पालन करने की अवधारणा का उपयोग किया गया है। कई प्रकार के पैरामीटर सेटिंग्स के माध्यम से विभिन्न समय चक्रों के लिए अनुकूलन किया जा सकता है, जीत की दर और लाभप्रदता मजबूत है। जोखिम नियंत्रण के बारे में भी कुछ विचार किए गए हैं, जिससे यह सुनिश्चित किया जा सके कि एकल हानि बहुत अधिक नहीं होगी। कुल मिलाकर, इस रणनीति में अधिक वैज्ञानिक तरीकों का उपयोग करके मूल्य प्रवृत्ति की विशेषताएं निकाली जाती हैं, फिर पैरामीटर अनुकूलन के लिए अधिक स्थान की विशेषता के साथ, आवेदन की संभावना अच्छी है।
/*backtest
start: 2024-02-17 00:00:00
end: 2024-02-18 00:00:00
period: 1h
basePeriod: 15m
exchanges: [{"eid":"Futures_Binance","currency":"BTC_USDT"}]
*/
// This source code is subject to the terms of the Mozilla Public License 2.0 at https://mozilla.org/MPL/2.0/
// © tathal animouse hajixde
//@version=4
strategy("LPB MicroCycles Strategy", "HPVWAP", overlay=true, default_qty_type=strategy.percent_of_equity, default_qty_value=100, max_bars_back=5000)
startDate = input(title="Start Date", type=input.integer,
defval=1, minval=1, maxval=31)
startMonth = input(title="Start Month", type=input.integer,
defval=1, minval=1, maxval=12)
startYear = input(title="Start Year", type=input.integer,
defval=2010, minval=1800, maxval=2100)
endDate = input(title="End Date", type=input.integer,
defval=31, minval=1, maxval=31)
endMonth = input(title="End Month", type=input.integer,
defval=12, minval=1, maxval=12)
endYear = input(title="End Year", type=input.integer,
defval=2021, minval=1800, maxval=2100)
// STEP 2:
// Look if the close time of the current bar
// falls inside the date range
inDateRange = true
///
// Strategy Settings
var g_strategy = "Strategy Settings"
stopMultiplier = input(title="Stop Loss ATR", type=input.float, defval=1.0, group=g_strategy, tooltip="Stop loss multiplier (x ATR)")
rr = input(title="R:R", type=input.float, defval=1.0, group=g_strategy, tooltip="Risk:Reward profile")
/// Backtester Settings
var g_tester = "Backtester Settings"
startBalance = input(title="Starting Balance", type=input.float, defval=10000.0, group=g_tester, tooltip="Your starting balance for the custom inbuilt tester system")
riskPerTrade = input(title="Risk Per Trade", type=input.float, defval=1.0, group=g_tester, tooltip="Your desired % risk per trade (as a whole number)")
drawTester = input(title="Draw Backtester", type=input.bool, defval=true, group=g_tester, tooltip="Turn on/off inbuilt backtester display")
////////////////INPUTS///////////////////
lambda = input(defval = 1000, type = input.float, title = "Smoothing Factor (Lambda)", minval = 1)
leng = input(defval = 100, type = input.integer, title = "Filter Length", minval = 1)
src = ohlc4
atr = atr(14)
///////////Construct Arrays///////////////
a = array.new_float(leng, 0.0)
b = array.new_float(leng, 0.0)
c = array.new_float(leng, 0.0)
d = array.new_float(leng, 0.0)
e = array.new_float(leng, 0.0)
f = array.new_float(leng, 0.0)
/////////Initialize the Values///////////
ll1 = leng-1
ll2 = leng-2
for i = 0 to ll1
array.set(a,i, lambda*(-4))
array.set(b,i, src[i])
array.set(c,i, lambda*(-4))
array.set(d,i, lambda*6 + 1)
array.set(e,i, lambda)
array.set(f,i, lambda)
array.set(d, 0, lambda + 1.0)
array.set(d, ll1, lambda + 1.0)
array.set(d, 1, lambda * 5.0 + 1.0)
array.set(d, ll2, lambda * 5.0 + 1.0)
array.set(c, 0 , lambda * (-2.0))
array.set(c, ll2, lambda * (-2.0))
array.set(a, 0 , lambda * (-2.0))
array.set(a, ll2, lambda * (-2.0))
//////////////Solve the optimization issue/////////////////////
float r = array.get(a, 0)
float s = array.get(a, 1)
float t = array.get(e, 0)
float xmult = 0.0
for i = 1 to ll2
xmult := r / array.get(d, i-1)
array.set(d, i, array.get(d, i) - xmult * array.get(c, i-1))
array.set(c, i, array.get(c, i) - xmult * array.get(f, i-1))
array.set(b, i, array.get(b, i) - xmult * array.get(b, i-1))
xmult := t / array.get(d, i-1)
r := s - xmult*array.get(c, i-1)
array.set(d, i+1, array.get(d, i+1) - xmult * array.get(f, i-1))
array.set(b, i+1, array.get(b, i+1) - xmult * array.get(b, i-1))
s := array.get(a, i+1)
t := array.get(e, i)
xmult := r / array.get(d, ll2)
array.set(d, ll1, array.get(d, ll1) - xmult * array.get(c, ll2))
x = array.new_float(leng, 0)
array.set(x, ll1, (array.get(b, ll1) - xmult * array.get(b, ll2)) / array.get(d, ll1))
array.set(x, ll2, (array.get(b, ll2) - array.get(c, ll2) * array.get(x, ll1)) / array.get(d, ll2))
for j = 0 to leng-3
i = leng-3 - j
array.set(x, i, (array.get(b,i) - array.get(f,i)*array.get(x,i+2) - array.get(c,i)*array.get(x,i+1)) / array.get(d, i))
//////////////Construct the output///////////////////
HP = array.get(x,0)
///////////////Custom VWAP////////////////////////
TimeFrame = input('1', type=input.resolution)
start = security(syminfo.tickerid, TimeFrame, time)
//------------------------------------------------
newSession = iff(change(start), 1, 0)
//------------------------------------------------
vwapsum = 0.0
vwapsum := iff(newSession, HP*volume, vwapsum[1]+HP*volume)
volumesum = 0.0
volumesum := iff(newSession, volume, volumesum[1]+volume)
v2sum = 0.0
v2sum := iff(newSession, volume*HP*HP, v2sum[1]+volume*HP*HP)
myvwap = vwapsum/volumesum
dev = sqrt(max(v2sum/volumesum - myvwap*myvwap, 0))
Coloring=close>myvwap?color.new(#81c784, 62):color.new(#c2185b, 38)
av=myvwap
showBcol = input(true, type=input.bool, title="Show barcolors")
///////////////Entry & Exit///////////////////
// Custom function to convert pips into whole numbers
toWhole(number) =>
return = atr < 1.0 ? (number / syminfo.mintick) / (10 / syminfo.pointvalue) : number
return := atr >= 1.0 and atr < 100.0 and syminfo.currency == "JPY" ? return * 100 : return
// Custom function to convert whole numbers back into pips
toPips(number) =>
return = atr >= 1.0 ? number : (number * syminfo.mintick) * (10 / syminfo.pointvalue)
return := atr >= 1.0 and atr < 100.0 and syminfo.currency == "JPY" ? return / 100 : return
// Custom function to truncate (cut) excess decimal places
truncate(_number, _decimalPlaces) =>
_factor = pow(10, _decimalPlaces)
int(_number * _factor) / _factor
///////////////Conditional Strategy Logic//////////////
Long = crossover(av, ohlc4)
Sell = crossunder(av, ohlc4)
// Check if we have confirmation for our setup
validLong = Long and strategy.position_size == 0 and inDateRange and barstate.isconfirmed
validShort = Sell and strategy.position_size == 0 and inDateRange and barstate.isconfirmed
// Calculate our stop distance & size for the current bar
stopSize = atr * stopMultiplier
longStopPrice = low < low[1] ? low - stopSize : low[1] - stopSize
longStopDistance = close - longStopPrice
longTargetPrice = close + (longStopDistance * rr)
// Save trade stop & target & position size if a valid setup is detected
var t_entry = 0.0
var t_stop = 0.0
var t_target = 0.0
var t_direction = 0
// Detect valid long setups & trigger alert
if validLong
t_entry := close
t_stop := longStopPrice
t_target := longTargetPrice
t_direction := 1
strategy.entry(id="Long", long=strategy.long, when=validLong, comment="(SL=" + tostring(truncate(toWhole(longStopDistance),2)) + " pips)")
// Fire alerts
alert(message="Long Detected", freq=alert.freq_once_per_bar_close)
// Check if price has hit long stop loss or target
if t_direction == 1 and (low <= t_stop or high >= t_target)
t_direction := 0
// Check if price has hit short stop loss or target
if t_direction == -1 and (high >= t_stop or low <= t_target)
t_direction := 0
// Exit trades whenever our stop or target is hit
strategy.exit(id="Long Exit", from_entry="Long", limit=t_target, stop=t_stop, when=strategy.position_size > 0)
// Draw trade data
plot(strategy.position_size != 0 or validLong? t_stop : na, title="Trade Stop Price", color=color.red, style=plot.style_linebr)
plot(strategy.position_size != 0 or validLong? t_target : na, title="Trade Target Price", color=color.green, style=plot.style_linebr)
/////////////////////Plotting//////////////////////////
A=plot(av, color=Coloring, title="HP VWAP")
barcolor(showBcol?Coloring:na)
fill(A, plot(ohlc4), Coloring)
// Draw price action setup arrows
plotshape(validLong ? 1 : na, style=shape.triangleup, location=location.belowbar, color=color.green, title="Bullish Setup")
// // --- BEGIN TESTER CODE --- //
// // Declare performance tracking variables
// var balance = startBalance
// var drawdown = 0.0
// var maxDrawdown = 0.0
// var maxBalance = 0.0
// var totalPips = 0.0
// var totalWins = 0
// var totalLoss = 0
// // Detect winning trades
// if strategy.wintrades != strategy.wintrades[1]
// balance := balance + ((riskPerTrade / 100) * balance) * rr
// totalPips := totalPips + abs(t_entry - t_target)
// totalWins := totalWins + 1
// if balance > maxBalance
// maxBalance := balance
// // Detect losing trades
// if strategy.losstrades != strategy.losstrades[1]
// balance := balance - ((riskPerTrade / 100) * balance)
// totalPips := totalPips - abs(t_entry - t_stop)
// totalLoss := totalLoss + 1
// // Update drawdown
// drawdown := (balance / maxBalance) - 1
// if drawdown < maxDrawdown
// maxDrawdown := drawdown
// // Prepare stats table
// var table testTable = table.new(position.top_right, 5, 2, border_width=1)
// f_fillCell(_table, _column, _row, _title, _value, _bgcolor, _txtcolor) =>
// _cellText = _title + "\n" + _value
// table.cell(_table, _column, _row, _cellText, bgcolor=_bgcolor, text_color=_txtcolor)
// // Draw stats table
// var bgcolor = color.new(color.black,0)
// if drawTester
// if barstate.islastconfirmedhistory
// // Update table
// dollarReturn = balance - startBalance
// f_fillCell(testTable, 0, 0, "Total Trades:", tostring(strategy.closedtrades), bgcolor, color.white)
// f_fillCell(testTable, 0, 1, "Win Rate:", tostring(truncate((strategy.wintrades/strategy.closedtrades)*100,2)) + "%", bgcolor, color.white)
// f_fillCell(testTable, 1, 0, "Starting:", "$" + tostring(startBalance), bgcolor, color.white)
// f_fillCell(testTable, 1, 1, "Ending:", "$" + tostring(truncate(balance,2)), bgcolor, color.white)
// f_fillCell(testTable, 2, 0, "Return:", "$" + tostring(truncate(dollarReturn,2)), dollarReturn > 0 ? color.green : color.red, color.white)
// f_fillCell(testTable, 2, 1, "Pips:", (totalPips > 0 ? "+" : "") + tostring(truncate(toWhole(totalPips),2)), bgcolor, color.white)
// f_fillCell(testTable, 3, 0, "Return:", (dollarReturn > 0 ? "+" : "") + tostring(truncate((dollarReturn / startBalance)*100,2)) + "%", dollarReturn > 0 ? color.green : color.red, color.white)
// f_fillCell(testTable, 3, 1, "Max DD:", tostring(truncate(maxDrawdown*100,2)) + "%", color.red, color.white)
// // --- END TESTER CODE --- //