डीईएमए क्रॉसओवर ट्रेंड फॉलोइंग रणनीति
अवलोकन
यह रणनीति ट्रेडिंग सिग्नल के रूप में द्वि-सूचक चलती औसत (डीईएमए) के क्रॉसिंग पर आधारित है, एक ट्रेंड ट्रैकिंग विधि का उपयोग करती है, स्वचालित रूप से स्टॉप और स्टॉप को सेट करती है। रणनीति का लाभ यह है कि ट्रेडिंग सिग्नल स्पष्ट है, स्टॉप और स्टॉप की सेटिंग लचीली है, जो जोखिम को प्रभावी ढंग से नियंत्रित करने में सक्षम है।
रणनीति सिद्धांत
गणना त्वरित लाइन डीईएमए ((8 दिन), धीमी लाइन डीईएमए ((24 दिन) और सहायक लाइन डीईएमए ((कॉन्फ़िगर किया जा सकता है) ।
जब तेज लाइन पर धीमी लाइन को पार करने से गोल्ड फोर्क सिग्नल उत्पन्न हो, तो अधिक करें; जब तेज लाइन के नीचे धीमी लाइन को पार करने से डेड फोर्क सिग्नल उत्पन्न हो, तो खाली करें।
ट्रेडिंग सिग्नल फ़िल्टर जोड़ा गया है, जो केवल तभी सिग्नल उत्पन्न करता है जब सहायक लाइन का दिन का मूल्य पिछले दिन से अधिक होता है, ताकि झूठे ब्रेक से बचा जा सके।
ट्रेंड ट्रैकिंग स्टॉप-लॉस तंत्र का उपयोग करते हुए, स्टॉप-लॉस लाइन को कीमतों के साथ समायोजित किया जाता है, जिससे यह सुनिश्चित होता है कि स्टॉप-लॉस बिंदु लाभ के कुछ हिस्सों को लॉक करता है।
एक निश्चित अनुपात के साथ स्टॉप लॉस और स्टॉप स्टॉप सेट करें और एक एकल लेनदेन के अधिकतम नुकसान और लाभ को नियंत्रित करें।
रणनीतिक लाभ
ट्रेडिंग सिग्नल स्पष्ट हैं, और यह निर्धारित करना आसान है कि कब प्रवेश करना है।
डबल डीईएमए एल्गोरिथ्म अधिक चिकनी है, ओवर-ऑप्टिमाइज़ेशन से बचा जाता है, और सिग्नल अधिक विश्वसनीय है।
सहायक तार फ़िल्टरिंग सिग्नल निर्णय प्रभाव को बढ़ाता है और झूठे सिग्नल को कम करता है।
ट्रेंड ट्रैकिंग स्टॉप लॉस का उपयोग करके, आप लाभ के कुछ हिस्सों को लॉक कर सकते हैं और जोखिम को नियंत्रित कर सकते हैं।
फिक्स्ड अनुपात स्टॉप लॉस स्टॉप सेट करें, एकल लेनदेन के अधिकतम नुकसान को नियंत्रित करें और जोखिम सीमा से परे न जाएं।
रणनीतिक जोखिम
अस्थिरता के दौरान, अक्सर लेन-देन हो सकता है, जिससे जोखिम बढ़ सकता है और रणनीतिक नुकसान हो सकता है।
स्थिर स्टॉप अनुपात बहुत बड़ा है, जो असामान्य परिस्थितियों में बड़े स्टॉप को ट्रिगर कर सकता है।
डीईएमए क्रॉस सिग्नल में देरी, तेजी के दौरान बाजार के उच्च बिंदु के पास खरीदारी से नुकसान का जोखिम बढ़ जाता है।
फिक्स्ड डिस्क की तैनाती के दौरान, स्लाइड पॉइंट लागत लाभप्रदता को प्रभावित करती है और स्टॉप-स्टॉप-लॉस पैरामीटर को समायोजित करने की आवश्यकता होती है।
रणनीति अनुकूलन
बाजार की स्थिति के अनुसार डीईएमए पैरामीटर को अनुकूलित किया जा सकता है ताकि इष्टतम संतुलन बिंदु की तलाश की जा सके।
फिक्स्ड स्टॉप को उचित रूप से विस्तारित करने के लिए फिक्स्ड स्टॉप लागत को ध्यान में रखते हुए।
सिग्नल प्रभाव को बढ़ाने के लिए अन्य सहायक निर्णय संकेतक जैसे कि MACD को जोड़ा जा सकता है।
स्टॉप लॉजिक को अनुकूलित करने के लिए स्टॉप लॉस स्टेप ट्रैक को सेट किया जा सकता है
संक्षेप
यह रणनीति DEMA की प्रवृत्ति निर्णय क्षमता का उपयोग करती है, जो प्रवृत्ति ट्रैकिंग तंत्र के साथ जोखिम नियंत्रण में है, जो कि ट्रेडिंग रणनीति प्रणाली में एक बहुत ही विशिष्ट प्रतिनिधि है। कुल मिलाकर, यह रणनीति संकेत स्पष्ट है, स्टॉप लॉस स्टॉप सेट उचित है, और एक आसान-से-महसूस, जोखिम-नियंत्रित ट्रेडिंग रणनीति है। स्लाइडिंग लागत अनुकूलन और सहायक संकेतक निर्णय के साथ संयोजन में, यह बेहतर निवेश रिटर्न प्राप्त करने के लिए संभव है।
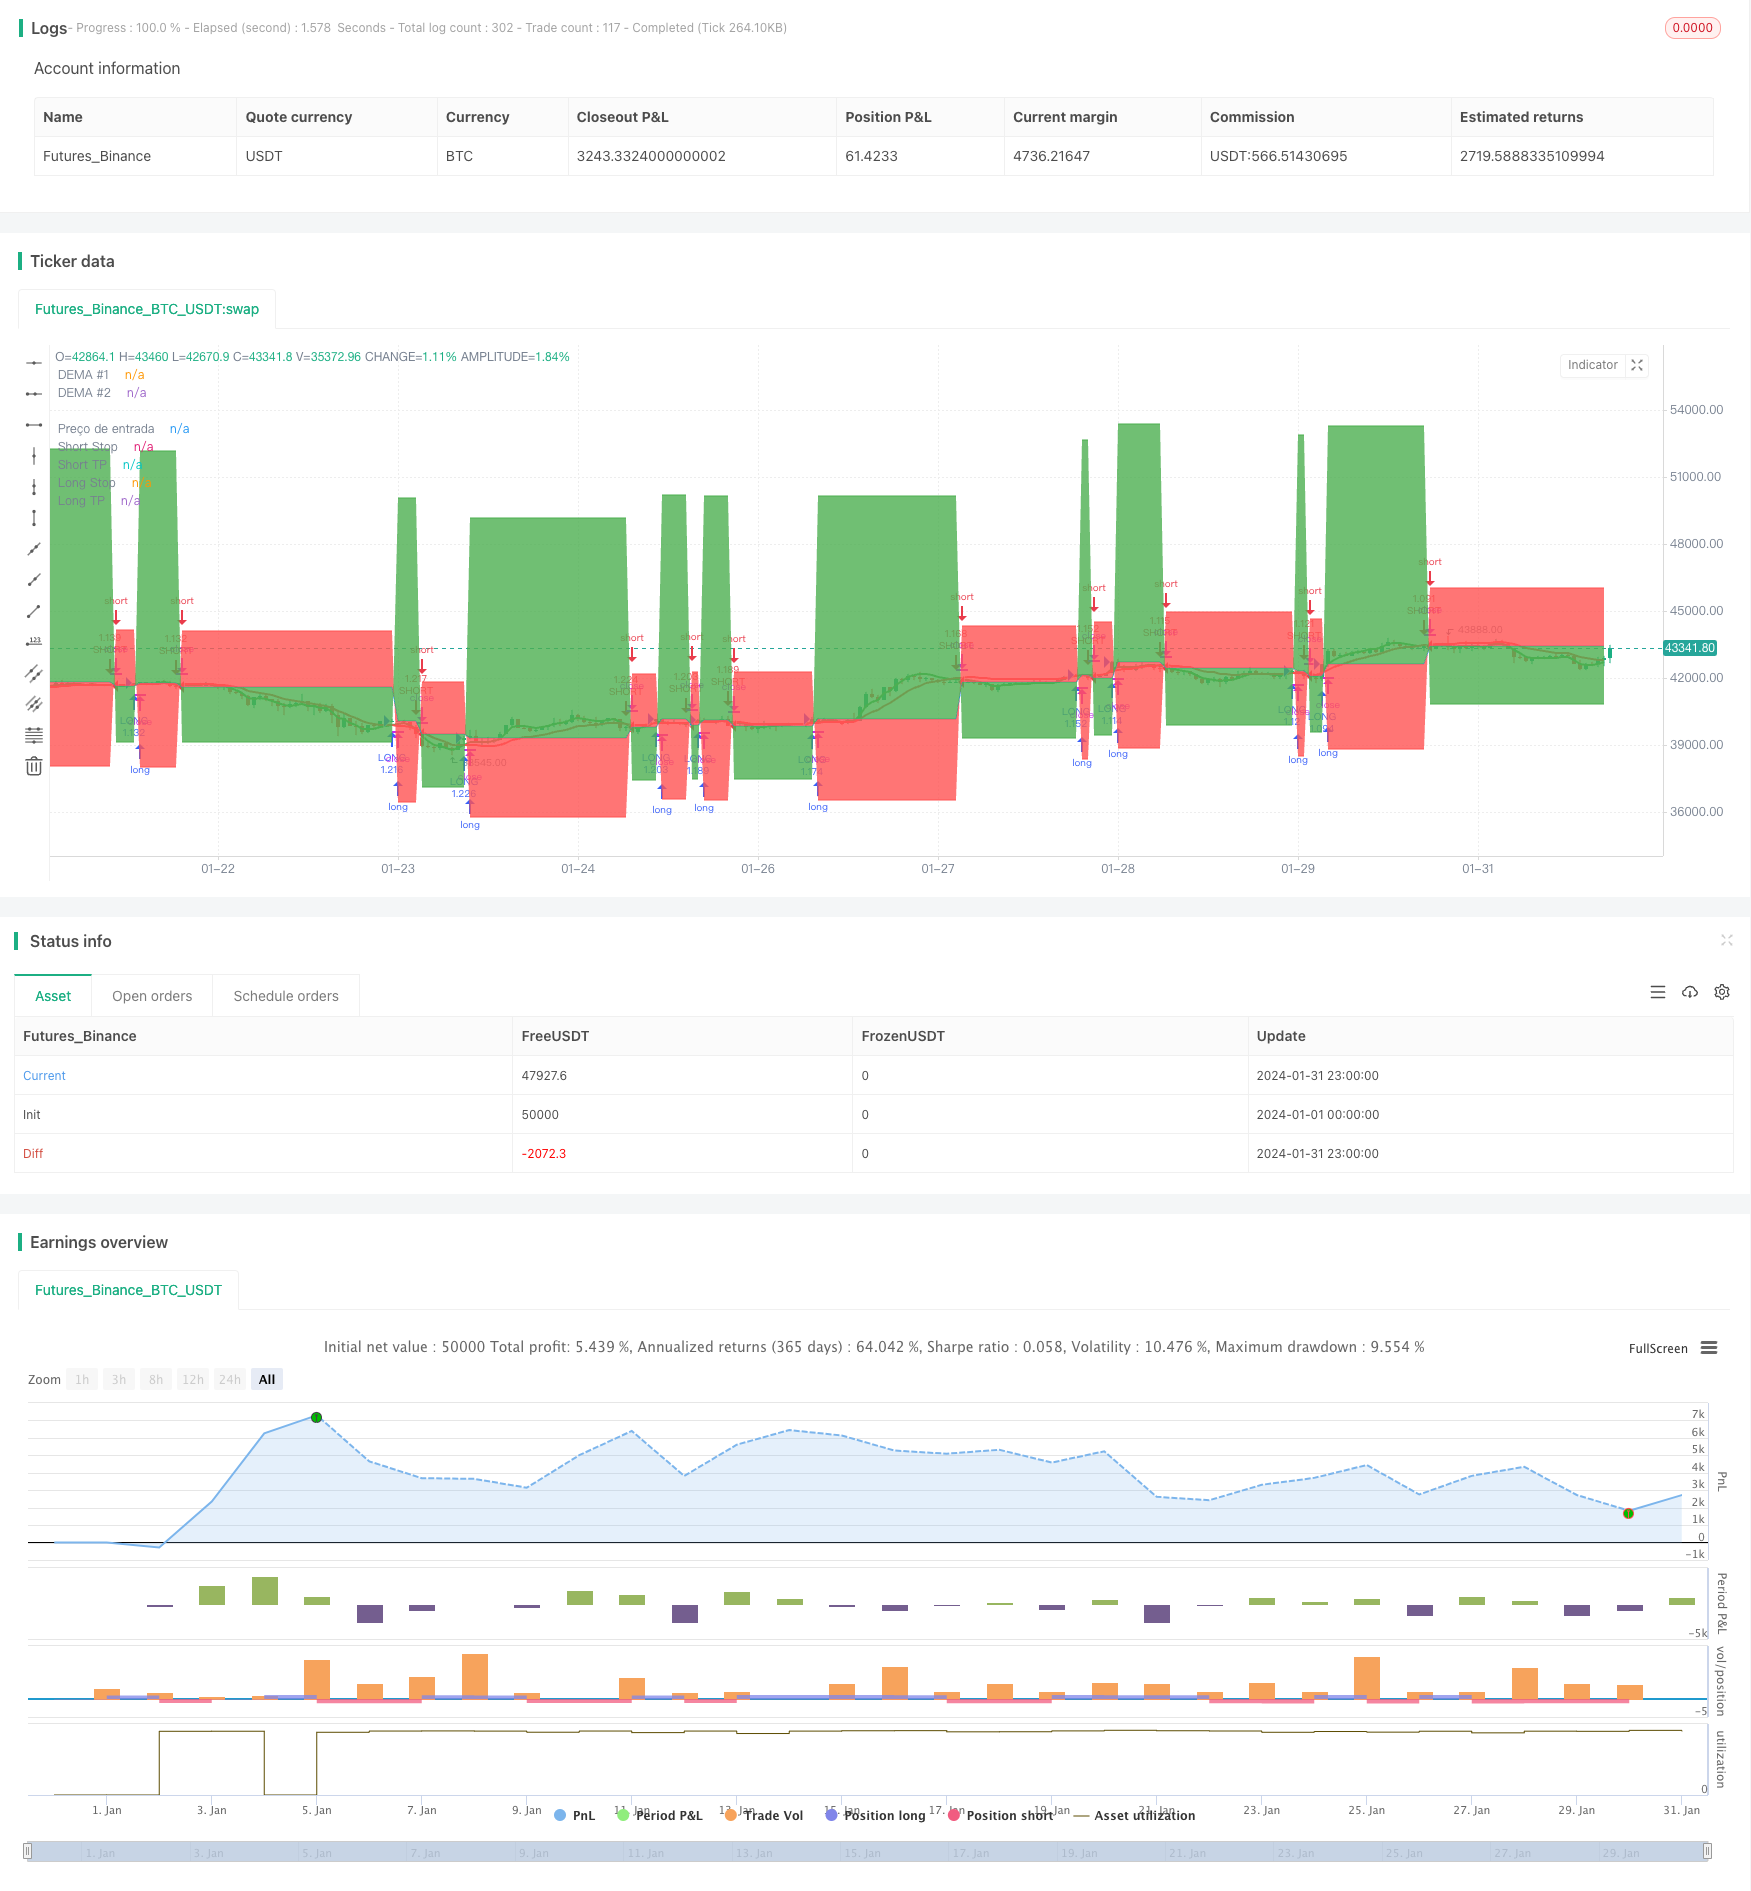
/*backtest
start: 2024-01-01 00:00:00
end: 2024-01-31 23:59:59
period: 1h
basePeriod: 15m
exchanges: [{"eid":"Futures_Binance","currency":"BTC_USDT"}]
*/

// This source code is subject to the terms of the Mozilla Public License 2.0 at https://mozilla.org/MPL/2.0/
// © zeguela
//@version=4
strategy(title="ZEGUELA DEMABOT", commission_value=0.063, commission_type=strategy.commission.percent, initial_capital=100, default_qty_value=90, default_qty_type=strategy.percent_of_equity, overlay=true, process_orders_on_close=true)

// Step 1. Script settings

// Input options
srcData = input(title="Source Data", type=input.source, defval=close)

// Length settings
len1 = input(title="Length DEMA #1", type=input.integer, defval=8, minval=1)
len2 = input(title="Length DEMA #2", type=input.integer, defval=24, minval=0)
len3 = input(title="Length DEMA #3", type=input.integer, defval=0, minval=0)

// Step 2. Calculate indicator values
// Function that calculates the DEMA
DEMA(series, length) =>
    if (length > 0)
        emaValue = ema(series, length)
        2 * emaValue - ema(emaValue, length)
    else
        na

// Calculate the DEMA values
demaVal1 = DEMA(srcData, len1)
demaVal2 = DEMA(srcData, len2)
demaVal3 = DEMA(srcData, len3)

// Step 3. Determine indicator signals
// See if there's a DEMA crossover
demaCrossover = if (len2 > 0) and (len3 > 0)
    crossover(demaVal1, demaVal2) and (demaVal3 > demaVal3[1])
else
    if (len2 > 0) and (len3 == 0)
        crossover(demaVal1, demaVal2)
    else
        if (len3 > 0) and (len2 == 0)
            crossover(demaVal1, demaVal3)
        else
            crossover(close, demaVal1)

// Check if there's a DEMA crossunder
demaCrossunder = if (len2 > 0) and (len3 > 0)
    crossunder(demaVal1, demaVal2) and (demaVal3 < demaVal3[1])
else
    if (len2 > 0) and (len3 == 0)
        crossunder(demaVal1, demaVal2)
    else
        if (len3 > 0) and (len2 == 0)
            crossunder(demaVal1, demaVal3)
        else
            crossunder(close, demaVal1)

// Step 4. Output indicator data
// Plot DEMAs on the chart
plot(series=demaVal1, color=color.green, linewidth=2, title="DEMA #1")
plot(series=demaVal2, color=color.red, linewidth=2, title="DEMA #2")
plot(series=demaVal3, color=color.fuchsia, linewidth=2, title="DEMA #3")

//TRAILING STOP CODE
a = input(title="Usar Trailing Stop?", type=input.bool, defval=false)

stopPerlong = input(9.0, title='Stop Loss Long %', type=input.float, group="Stop Loss & Take Profit Settings") / 100
stopPershort = input(6.0, title='Stop Loss Short %', type=input.float, group="Stop Loss & Take Profit Settings") / 100
take1Perlong = input(25.0, title='Take Profit Long % 1', type=input.float, group="Stop Loss & Take Profit Settings") / 100
take1Pershort = input(6.0, title='Take Profit Short % 1', type=input.float, group="Stop Loss & Take Profit Settings") / 100

// Determine stop loss price
longStopPrice  = strategy.position_avg_price * (1 - stopPerlong)
shortStopPrice = strategy.position_avg_price * (1 + stopPershort)
longTake1Price = strategy.position_avg_price * (1 + take1Perlong)
shortTake1Price = strategy.position_avg_price * (1 - take1Pershort)

// Determine trail stop loss prices

longStopPriceTrail = 0.0

longStopPriceTrail := if (strategy.position_size > 0)
    stopValue = close * (1 - stopPerlong)
    max(stopValue, longStopPriceTrail[1])
else
    0

// Determine trailing short price
shortStopPriceTrail = 0.0

shortStopPriceTrail := if (strategy.position_size < 0)
    stopValue = close * (1 + stopPershort)
    min(stopValue, shortStopPriceTrail[1])
else
    999999

//calcular qual stop usar
longStop = a ? longStopPriceTrail : longStopPrice
shortStop = a ? shortStopPriceTrail : shortStopPrice


//calcula o valor do stop e TP pra lançar no alerta
longStopEntrada = close  * (1 - stopPerlong)
shortStopEntrada = close  * (1 + stopPershort)
longTPEntrada = close * (1 + take1Perlong)
shortTPEntrada = close * (1 - take1Pershort)

//armazena o preço de entrada e valor do SL e TP

price_entryL = 0.0
price_entryL := na(price_entryL) ? na : price_entryL[1]
price_entryS = 0.0
price_entryS := na(price_entryS) ? na : price_entryS[1]
stopL = 0.0
stopL := na(stopL) ? na : stopL[1]
stopS = 0.0
stopS := na(stopS) ? na : stopS[1]
takeL = 0.0
takeL := na(takeL) ? na : takeL[1]
takeS = 0.0
takeS := na(takeS) ? na : takeS[1]

if (demaCrossover)
    price_entryL := close
    stopL := close  * (1 - stopPerlong)
    takeL := close * (1 + take1Perlong)

if (demaCrossunder)
    price_entryS := close
    stopS := close  * (1 + stopPershort)
    takeS := close * (1 - take1Pershort)

resultadoL = ((close - price_entryL)/price_entryL) * 100
resultadoLexit = "(SL = 1% e TP = 0,5%)"
resultadoS = ((price_entryS - close)/price_entryS) * 100
resultadoSexit = "(SL = 1% e TP = 0,5)%"
// Make input options that configure backtest date range
_startDate = input(title="Start Date", type=input.integer,
     defval=1, minval=1, maxval=31, group="BackTest Period")
_startMonth = input(title="Start Month", type=input.integer,
     defval=1, minval=1, maxval=12, group="BackTest Period")
_startYear = input(title="Start Year", type=input.integer,
     defval=2018, minval=1800, maxval=2100, group="BackTest Period")

_endDate = input(title="End Date", type=input.integer,
     defval=31, minval=1, maxval=31, group="BackTest Period")
_endMonth = input(title="End Month", type=input.integer,
     defval=12, minval=1, maxval=12, group="BackTest Period")
_endYear = input(title="End Year", type=input.integer,
     defval=2031, minval=1800, maxval=2100, group="BackTest Period")

// Look if the close time of the current bar
// falls inside the date range
_inDateRange = (time >= timestamp(syminfo.timezone, _startYear,
         _startMonth, _startDate, 0, 0)) and
     (time < timestamp(syminfo.timezone, _endYear, _endMonth, _endDate, 0, 0))

//Alert configuration

_alertMessageOpenLong="OpenLong"
_alertMessageCloseLong="CloseLong"
_alertmessageExitLong="ExitLong - TP/SL"

_alertMessageOpenShort="OpenShort"
_alertMessageCloseShort="CloseShort"
_alertMessageExitShort="ExitShort - TP/SL"

if (_inDateRange)
    //ENTER SOME SETUP TRADES FOR TSL EXAMPLE
    if (demaCrossover)
        strategy.entry("LONG", strategy.long, comment = _alertMessageOpenLong)
    if (demaCrossunder)
        strategy.entry("SHORT", strategy.short, comment = _alertMessageOpenShort)
    //EXIT TRADE @ TSL
    if strategy.position_size > 0
        strategy.exit("TP/SL", "LONG", stop=longStop, limit=longTake1Price, comment=_alertmessageExitLong, alert_message=_alertmessageExitLong)
    if strategy.position_size < 0
        strategy.exit("TP/SL", "SHORT", stop=shortStop, limit=shortTake1Price, comment =_alertMessageExitShort, alert_message=_alertMessageExitShort)


//Look & Feel - Plot stop loss and take profit areas
p1=plot(strategy.position_avg_price, color=color.blue, style=plot.style_linebr, linewidth=1, title="Preço de entrada")
p2=plot(series=strategy.position_size > 0 ? longStop : na, color=color.red, style=plot.style_linebr, linewidth=1, title="Long Stop")
p3=plot(series=strategy.position_size > 0 ? longTake1Price : na, color=color.green, style=plot.style_linebr, linewidth=1, title="Long TP")
p4=plot(series=strategy.position_size < 0 ? shortStop : na, color=color.red, style=plot.style_linebr, linewidth=1, title="Short Stop")
p5=plot(series=strategy.position_size < 0 ? shortTake1Price : na, color=color.green, style=plot.style_linebr, linewidth=1, title="Short TP")
fill(p1, p2, color=color.red)
fill(p1, p3, color=color.green)
fill(p1, p4, color=color.red)
fill(p1, p5, color=color.green)

// Insert label with value
stopLossOnLong = "Stop Loss = " + tostring(longStop)
stopLossOnShort = "Stop Loss = " + tostring(shortStop)
takeprofitOnLong = "Take Profit = " + tostring(longTake1Price)
takeprofitOnShort = "Take Profit = " + tostring(shortTake1Price)
precoentrada = "Entrada = " + tostring(strategy.position_avg_price)

var label FinalLabelpriceL = na
var label FinalLabelpriceS = na
var label slFinalLabelL = na
var label slFinalLabelS = na
var label slFinalLabelTPL = na
var label slFinalLabelTPS = na


//Draw entry and stop loss lines and labels

if strategy.position_size > 0

    //write the price above the end of the stoploss line
    slFinalLabelL := label.new(bar_index, longStop, stopLossOnLong, style=label.style_none, size=size.normal, textcolor=color.red)
    slFinalLabelTPL := label.new(bar_index, longTake1Price, takeprofitOnLong, style=label.style_none, size=size.normal, textcolor=color.green)
    FinalLabelpriceL := label.new(bar_index, strategy.position_avg_price, precoentrada, style=label.style_none, size=size.normal, textcolor=color.blue)

    // Delete previous label when there is a consecutive new high, as there's no line plot in that case.
    if strategy.position_size > 0[1]
        label.delete(slFinalLabelL[1])
        label.delete(slFinalLabelTPL[1])
        label.delete(FinalLabelpriceL[1])

if strategy.position_size < 0

    //write the price above the end of the stoploss line
    slFinalLabelS := label.new(bar_index, shortStop, stopLossOnShort, style=label.style_none, size=size.normal, textcolor=color.red)
    slFinalLabelTPS := label.new(bar_index, shortTake1Price, takeprofitOnShort, style=label.style_none, size=size.normal, textcolor=color.green)
    FinalLabelpriceS := label.new(bar_index, strategy.position_avg_price, precoentrada, style=label.style_none, size=size.normal, textcolor=color.blue)

    // Delete previous label when there is a consecutive new high, as there's no line plot in that case.
    if strategy.position_size < 0[1]
        label.delete(slFinalLabelS[1])
        label.delete(slFinalLabelTPS[1])
        label.delete(FinalLabelpriceS[1])


// Exit open market position when date range ends
if (not _inDateRange)
    strategy.close_all()