ट्रिपल ओवरलैप सुपरट्रेंड रणनीति
अवलोकन
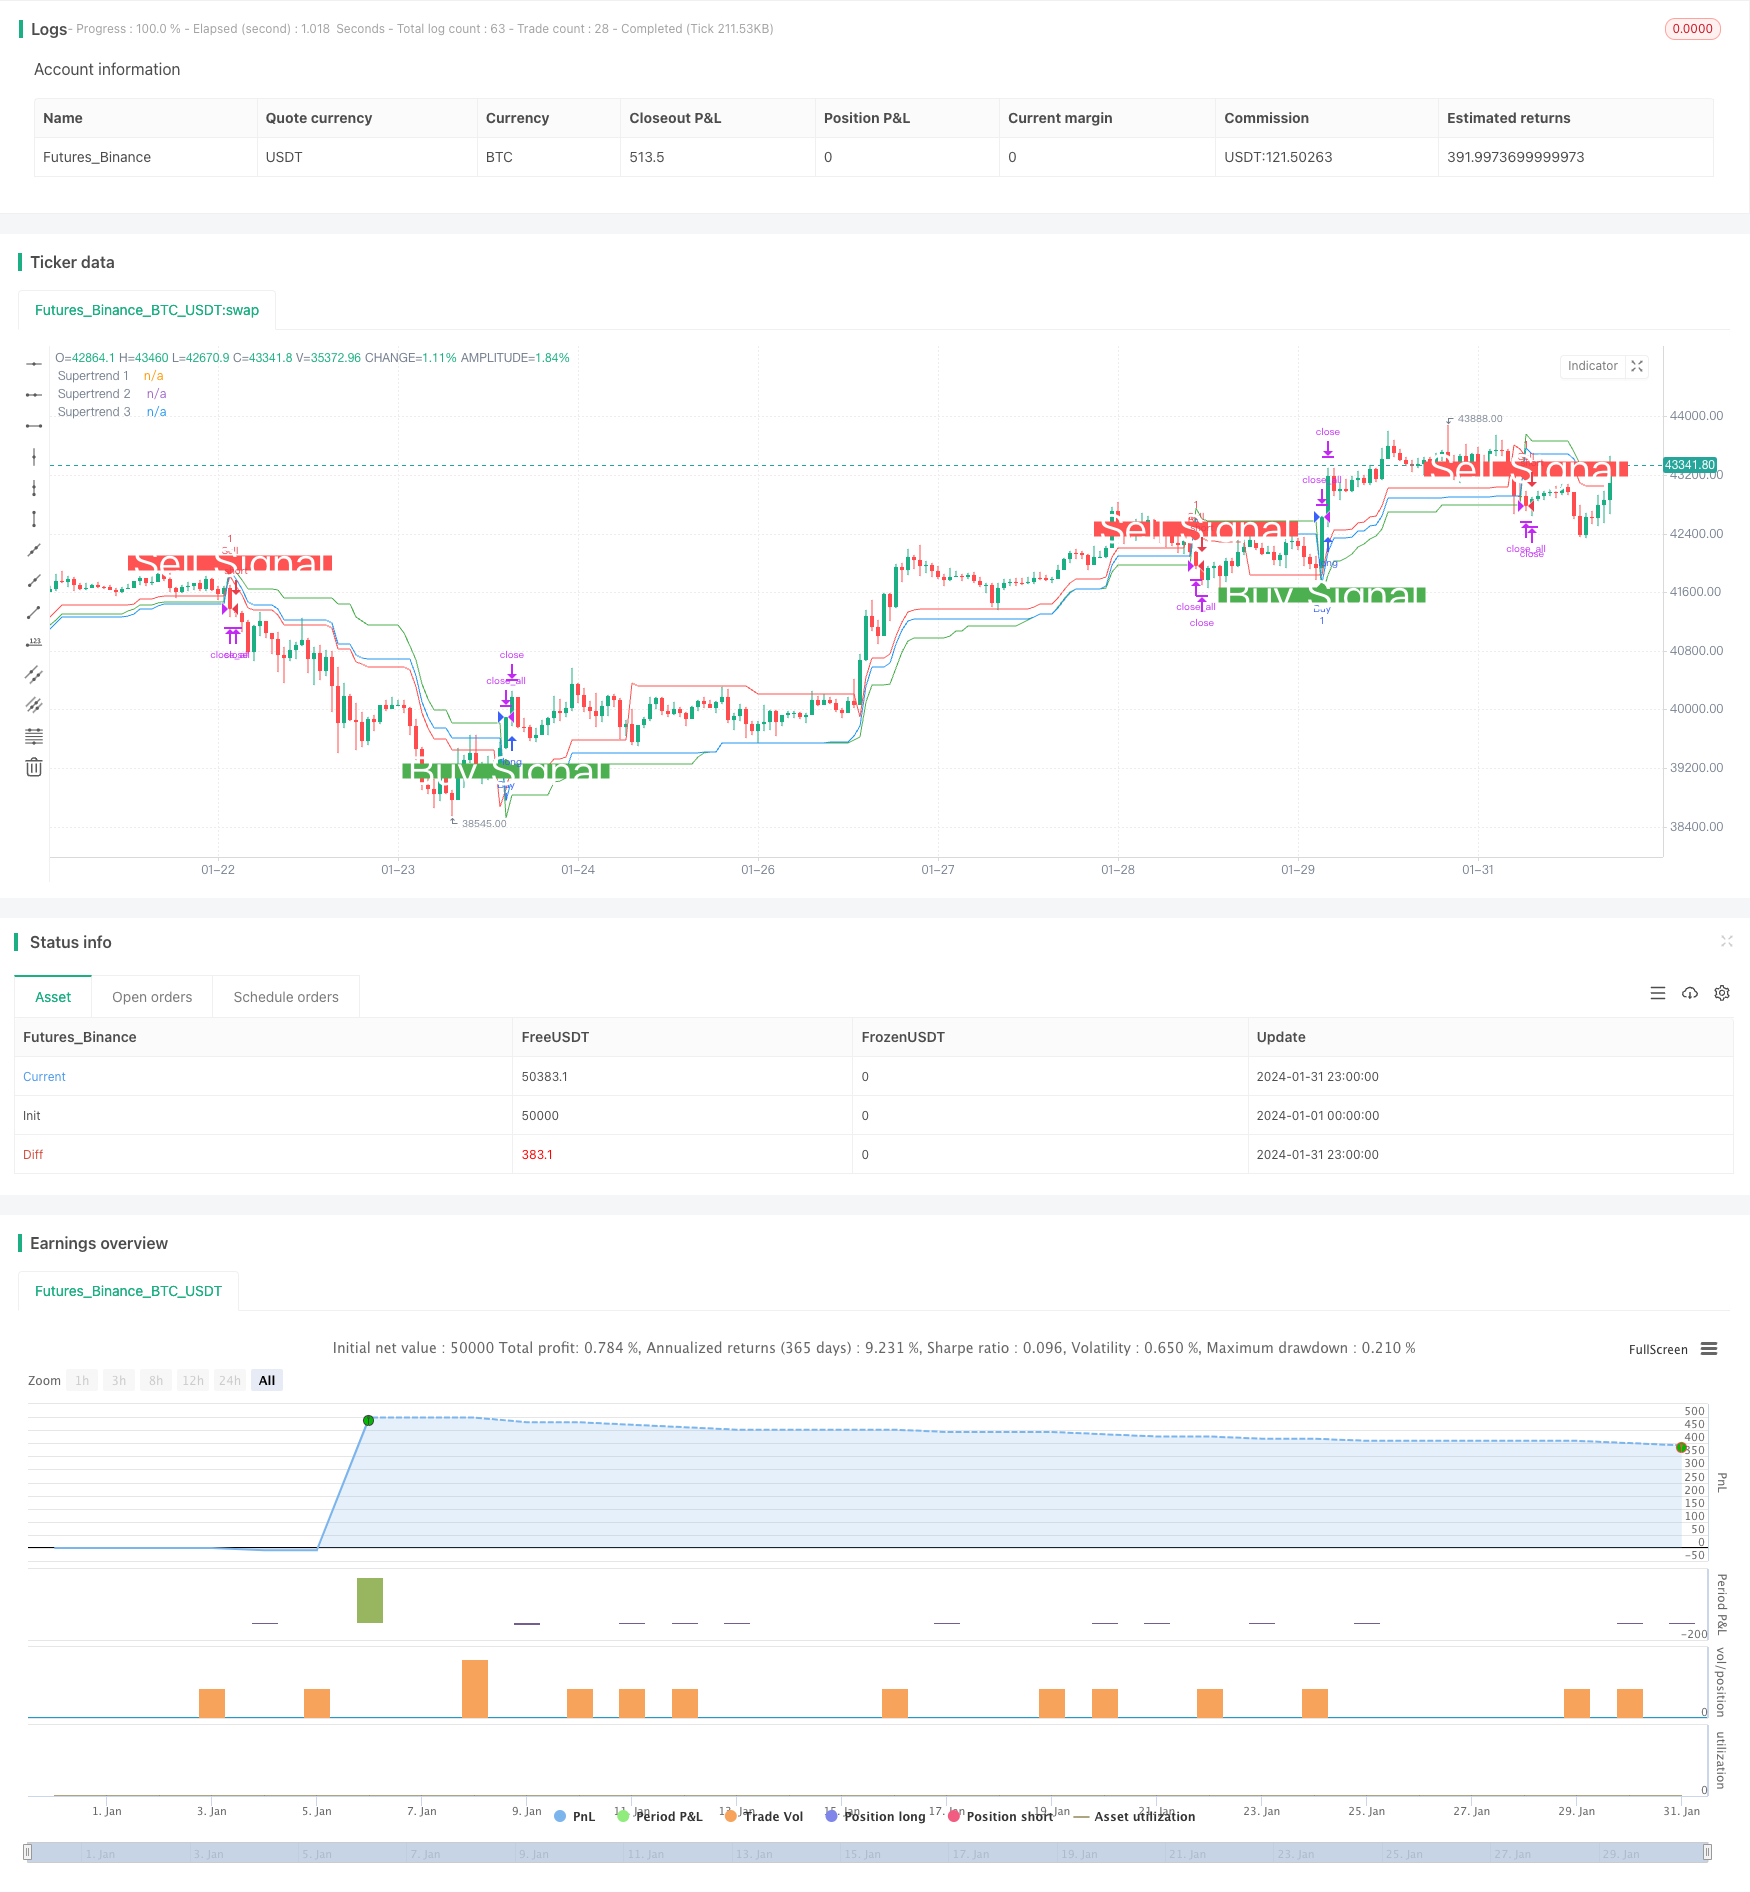
यह एक रणनीति है जो ट्रेडिंग निर्णय लेने के लिए ट्रिपल ओवरलैपिंग सुपरट्रेंडिंग सूचकांकों का उपयोग करती है। यह ट्रेंडिंग स्थितियों में बड़े दिशात्मक अवसरों को पकड़ने में सक्षम है।
रणनीति सिद्धांत
यह रणनीति तीन अलग-अलग पैरामीटर सेटिंग्स के साथ सुपरट्रेंड सूचक की गणना करने के लिए ta.supertrend () फ़ंक्शन का उपयोग करती है। 10 वें दिन 3 गुना एटीआर के लिए सुपरट्रेंड 1, 14 वें दिन 2 गुना एटीआर के लिए सुपरट्रेंड 2, और 20 वें दिन 2.5 गुना एटीआर के लिए सुपरट्रेंड 3 की गणना की जाती है। जब कीमत सभी तीन सुपरट्रेंड को पार करती है तो एक खरीद संकेत उत्पन्न करें। जब कीमत सभी तीन सुपरट्रेंड को पार करती है तो एक बेचने का संकेत उत्पन्न करें।
ओवरट्रेंडिंग सूचक एटीआर सूचक के साथ संयुक्त है, जो मूल्य परिवर्तन की प्रवृत्ति को प्रभावी ढंग से ट्रैक करने में सक्षम है। ट्रिपल ओवरट्रेंडिंग की रणनीति, जो संकेत को अधिक विश्वसनीय बनाती है, जिससे प्रवृत्ति की स्थिति में अधिक लाभ प्राप्त होता है।
रणनीतिक लाभ
- ट्रिपल फ़िल्टरिंग तंत्र, झूठे सिग्नल से बचने, सिग्नल की गुणवत्ता में सुधार
- सुपर ट्रेंड इंडिकेटर अपने आप में एक अच्छा शोर-मुक्ति है
- एक व्यापक बाजार परिदृश्य के लिए कई सुपर-पैरामीटर संयोजनों को कॉन्फ़िगर करें
- ऐतिहासिक परीक्षण अच्छा प्रदर्शन, जोखिम से अधिक लाभ
रणनीतिक जोखिम
- मल्टीफ़िल्टर सिग्नल कुछ अवसरों को याद कर सकते हैं
- भूकंप के दौरान प्रदर्शन अच्छा नहीं रहा
- तीन सेटों के सुपर पैरामीटर के संयोजन को अनुकूलित करने की आवश्यकता
- केंद्रीयकृत लेनदेन समय आकस्मिक घटनाओं से प्रभावित हो सकता है
जोखिम को कम करने के लिए निम्नलिखित बातों पर विचार किया जा सकता हैः
- फ़िल्टर शर्तों को समायोजित करें, एक या दो सुपर रुझानों को बनाए रखें
- स्टॉप लॉस को बढ़ाएं
- सुपर पैरामीटर का अनुकूलन करें और जीत की दर बढ़ाएं
रणनीति अनुकूलन दिशा
- सबसे अच्छा सुपरपैरामीटर खोजने के लिए अधिक संयोजनों का परीक्षण करें
- मशीन सीखने के एल्गोरिदम को जोड़ना, वास्तविक समय में पैरामीटर को अनुकूलित करना
- एकल हानि को नियंत्रित करने के लिए रोकथाम की रणनीति में वृद्धि
- अन्य संकेतकों के साथ मिलकर, रुझानों और उतार-चढ़ावों की पहचान करें
- एकल समय नोड के जोखिम से बचने के लिए ट्रेडिंग समय का विस्तार करें
संक्षेप
इस रणनीति में तीन ओवरलैप सुपरट्रेंड के माध्यम से निर्णय लेने के लिए, ट्रेंड की दिशा की पहचान करने में सक्षम है। इसके पास उच्च संकेत गुणवत्ता, पैरामीटर अनुकूलन और अन्य फायदे हैं। इसके साथ ही कुछ जोखिम भी हैं, विभिन्न बाजार स्थितियों के अनुकूल पैरामीटर और बाहर निकलने के समय को समायोजित करने की आवश्यकता है। कुल मिलाकर, यह रणनीति उत्कृष्ट प्रदर्शन कर रही है और आगे के अध्ययन और आवेदन के लायक है।
/*backtest
start: 2024-01-01 00:00:00
end: 2024-01-31 23:59:59
period: 1h
basePeriod: 15m
exchanges: [{"eid":"Futures_Binance","currency":"BTC_USDT"}]
*/

//@version=5
strategy('Combined Supertrend Strategy - Ajit Prasad', overlay=true)

// Function to calculate Supertrend
supertrendFunc(atrLength, factor) =>
    [supertrend, direction] = ta.supertrend(factor, atrLength)
    [supertrend, direction]

// Input parameters for the first Supertrend
atrPeriod1 = input(10, 'ATR Length 1')
factor1 = input(3, 'Factor 1')

// Calculate the first Supertrend
[supertrend1, direction1] = supertrendFunc(atrPeriod1, factor1)

// Input parameters for the second Supertrend
atrPeriod2 = input(14, 'ATR Length 2') // Change values as needed
factor2 = input(2, 'Factor 2') // Change values as needed

// Calculate the second Supertrend
[supertrend2, direction2] = supertrendFunc(atrPeriod2, factor2)

// Input parameters for the third Supertrend
atrPeriod3 = input(20, 'ATR Length 3') // Change values as needed
factor3 = input(2.5, 'Factor 3') // Change values as needed

// Calculate the third Supertrend
[supertrend3, direction3] = supertrendFunc(atrPeriod3, factor3)

// Define market opening and closing times
marketOpenHour = 9
marketOpenMinute = 15
marketCloseHour = 15
marketCloseMinute = 30
exitTimeHour = 15
exitTimeMinute = 10

// Fetch historical close values using security function
histClose = request.security(syminfo.tickerid, "D", close)

// Buy condition
buyCondition = close > supertrend1 and close > supertrend2 and close > supertrend3 and close[1] <= supertrend1[1]

// Sell condition
sellCondition = close < supertrend1 and close < supertrend2 and close < supertrend3 and close[1] >= supertrend1[1]

// Exit conditions
buyExitCondition = close < supertrend1[1] or close < supertrend2[1] or close < supertrend3[1]
sellExitCondition = close > supertrend1[1] or close > supertrend2[1] or close > supertrend3[1]

// Execute orders with market timing
if true
    // Buy condition without 'and not'
    strategy.entry('Buy', strategy.long, when = buyCondition)

    // Sell condition without 'and not'
    strategy.entry('Sell', strategy.short, when = sellCondition)

    // Close conditions
    strategy.close('Buy', when = buyExitCondition )
    strategy.close('Sell', when = sellExitCondition)

// Close all trades at 3:10 pm IST
if true
    strategy.close_all()

// Plot Supertrends
plot(supertrend1, 'Supertrend 1', color=color.new(color.green, 0), style=plot.style_linebr)
plot(supertrend2, 'Supertrend 2', color=color.new(color.red, 0), style=plot.style_linebr)
plot(supertrend3, 'Supertrend 3', color=color.new(color.blue, 0), style=plot.style_linebr)

// Plot labels
plotshape(buyCondition, style=shape.labelup, location=location.belowbar, color=color.new(color.green, 0), size=size.large, text='Buy Signal', textcolor=color.new(color.white, 0))
plotshape(sellCondition, style=shape.labeldown, location=location.abovebar, color=color.new(color.red, 0), size=size.large, text='Sell Signal', textcolor=color.new(color.white, 0))