VWAP और क्रॉस-पीरियड संकेतों के आधार पर लंबी और छोटी गतिशील स्टॉप-प्रॉफिट और स्टॉप-लॉस रणनीति
अवलोकन
इस रणनीति में प्रवेश और बाहर निकलने के संकेत के रूप में डेली लाइन के वीडब्ल्यूएपी का उपयोग किया जाता है। जब वीडब्ल्यूएपी को बंद करने की कीमत पर ट्रिगर किया जाता है, तो स्टॉप लॉस को वीडब्ल्यूएपी के नीचे पहले केके लाइन के निचले बिंदु पर सेट किया जाता है, लक्ष्य मूल्य को खोलने की कीमत से 3 अंक ऊपर सेट किया जाता है; जब वीडब्ल्यूएपी को बंद करने की कीमत को बंद करने के लिए ट्रिगर किया जाता है, तो स्टॉप लॉस को वीडब्ल्यूएपी के ऊपर पहले केके लाइन के उच्च बिंदु पर सेट किया जाता है, लक्ष्य मूल्य को खोलने की कीमत से 3 अंक नीचे सेट किया जाता है। इस रणनीति में कोई बाहर निकलने की शर्त शामिल नहीं है, और व्यापार तब तक होता है जब तक कि रिवर्स सिग्नल नहीं होता है।
रणनीति सिद्धांत
- प्रवृत्ति और ट्रेडिंग संकेतों के आधार के रूप में सूर्य रेखा के VWAP डेटा प्राप्त करना।
- यह निर्धारित करना कि क्या वर्तमान समापन मूल्य VWAP के माध्यम से ऊपर / नीचे है, क्रमशः अधिक और कम करने के लिए ट्रिगर के रूप में।
- यदि पूर्व K-लाइन का निचला बिंदु VWAP के नीचे है, तो इसे रोकें, अन्यथा VWAP को सीधे रोकें; वैकल्पिक रूप से।
- स्टॉक खोलने के बाद, 3 स्थिरीकृत स्टॉप सेट करें।
- रणनीति तब तक चलती रहती है जब तक कि रिवर्स सिग्नल को ट्रिगर नहीं किया जाता है और एक नया स्थान खोला जाता है।
गतिशील स्टॉपलॉस और फिक्स्ड पॉइंट स्टॉपलॉस का उपयोग करते हुए, क्रॉस-साइकिल वीडब्ल्यूपीएपी डेटा के माध्यम से रुझानों का आकलन करें, जिससे रुझान की स्थिति को प्रभावी ढंग से पकड़ने, वापसी के जोखिम को नियंत्रित करने और समय पर मुनाफे को लॉक करने में मदद मिल सके।
श्रेष्ठता विश्लेषण
- सरल और प्रभावीः रणनीति तर्क स्पष्ट है, केवल एक VWAP सूचक का उपयोग करके प्रवृत्ति निर्णय और सिग्नल ट्रिगर को लागू करना और अनुकूलित करना आसान है।
- गतिशील स्टॉप: स्टॉप को पूर्ववर्ती K लाइन के उच्च और निम्न बिंदुओं के आधार पर सेट किया जाता है, जो बाजार में उतार-चढ़ाव के लिए बेहतर रूप से अनुकूल है और जोखिम को कम करता है।
- फिक्स्ड पॉइंट्स स्टॉपः फिक्स्ड पॉइंट्स के साथ लक्ष्य मूल्य सेट करना, समय पर मुनाफे को लॉक करने में मदद करता है और मुनाफे को वापस लेने से बचाता है।
- समय पर स्टॉप-लॉस स्टॉपः रणनीति एक रिवर्स सिग्नल को ट्रिगर करने पर तुरंत पोजीशन को खत्म कर देती है, जो कि पहले से ही लाभदायक स्टॉप पर अतिरिक्त नुकसान नहीं पहुंचाएगी, साथ ही नई पोजीशन खोलेगी और नए रुझानों को पकड़ लेगी।
जोखिम विश्लेषण
- पैरामीटर अनुकूलनः रणनीति में एक निश्चित 3 बिंदुओं का उपयोग किया जाता है, जो वास्तविक लेनदेन के लिए विभिन्न मापदंडों और बाजार विशेषताओं के अनुसार अनुकूलन की आवश्यकता हो सकती है, सबसे अच्छा पैरामीटर चुनने के लिए।
- अस्थिरता: अस्थिरता में, बार-बार प्रवेश और प्रस्थान से लेनदेन की लागत अधिक हो सकती है, जिससे लाभ प्रभावित हो सकता है।
- रुझान निरंतरता: रणनीति रुझान पर निर्भर करती है, और यदि बाजार में अस्थिरता है, या रुझान निरंतरता खराब है, तो अधिक व्यापारिक संकेत हो सकते हैं, जिससे अधिक जोखिम होता है।
अनुकूलन दिशा
- रुझान फ़िल्टरिंगः अन्य रुझान संकेतकों जैसे कि चलती औसत, एमएसीडी आदि को जोड़कर, रुझान की दूसरी पुष्टि करें, संकेत की विश्वसनीयता में सुधार करें।
- गतिशील स्टॉपः बाजार की अस्थिरता, एटीआर जैसे संकेतकों के आधार पर स्टॉप पॉइंट की संख्या को गतिशील रूप से समायोजित करें ताकि यह बाजार के अनुकूल हो सके।
- पोजीशन मैनेजमेंटः खाते की राशि, जोखिम वरीयता आदि के आधार पर प्रत्येक ट्रेड के लिए पोजीशन आकार को गतिशील रूप से समायोजित करें।
- ट्रेडिंग समय का चयन करेंः संकेतकों की विशेषताओं और ट्रेडिंग सक्रियता के आधार पर सर्वोत्तम ट्रेडिंग समय का चयन करें, रणनीति की दक्षता में सुधार करें।
संक्षेप
यह रणनीति ट्रेंड निर्णय और सिग्नल ट्रिगर के लिए क्रॉस-साइक्ल VWAP डेटा का उपयोग करती है, जबकि गतिशील स्टॉप और फिक्स्ड पॉइंट स्टॉप का उपयोग करके जोखिम को नियंत्रित करती है और मुनाफे को लॉक करती है। यह एक सरल और प्रभावी मात्रात्मक व्यापार रणनीति है। रुझान फ़िल्टरिंग, गतिशील स्टॉप, स्थिति प्रबंधन और ट्रेडिंग समय चयन जैसे पहलुओं का अनुकूलन करके रणनीति की स्थिरता और आय क्षमता को और बढ़ाया जा सकता है। लेकिन वास्तविक अनुप्रयोगों में, बाजार की विशेषताओं, व्यापार लागत और पैरामीटर अनुकूलन जैसे कारकों पर ध्यान देने की आवश्यकता है ताकि बेहतर रणनीति प्रदर्शन हो सके।
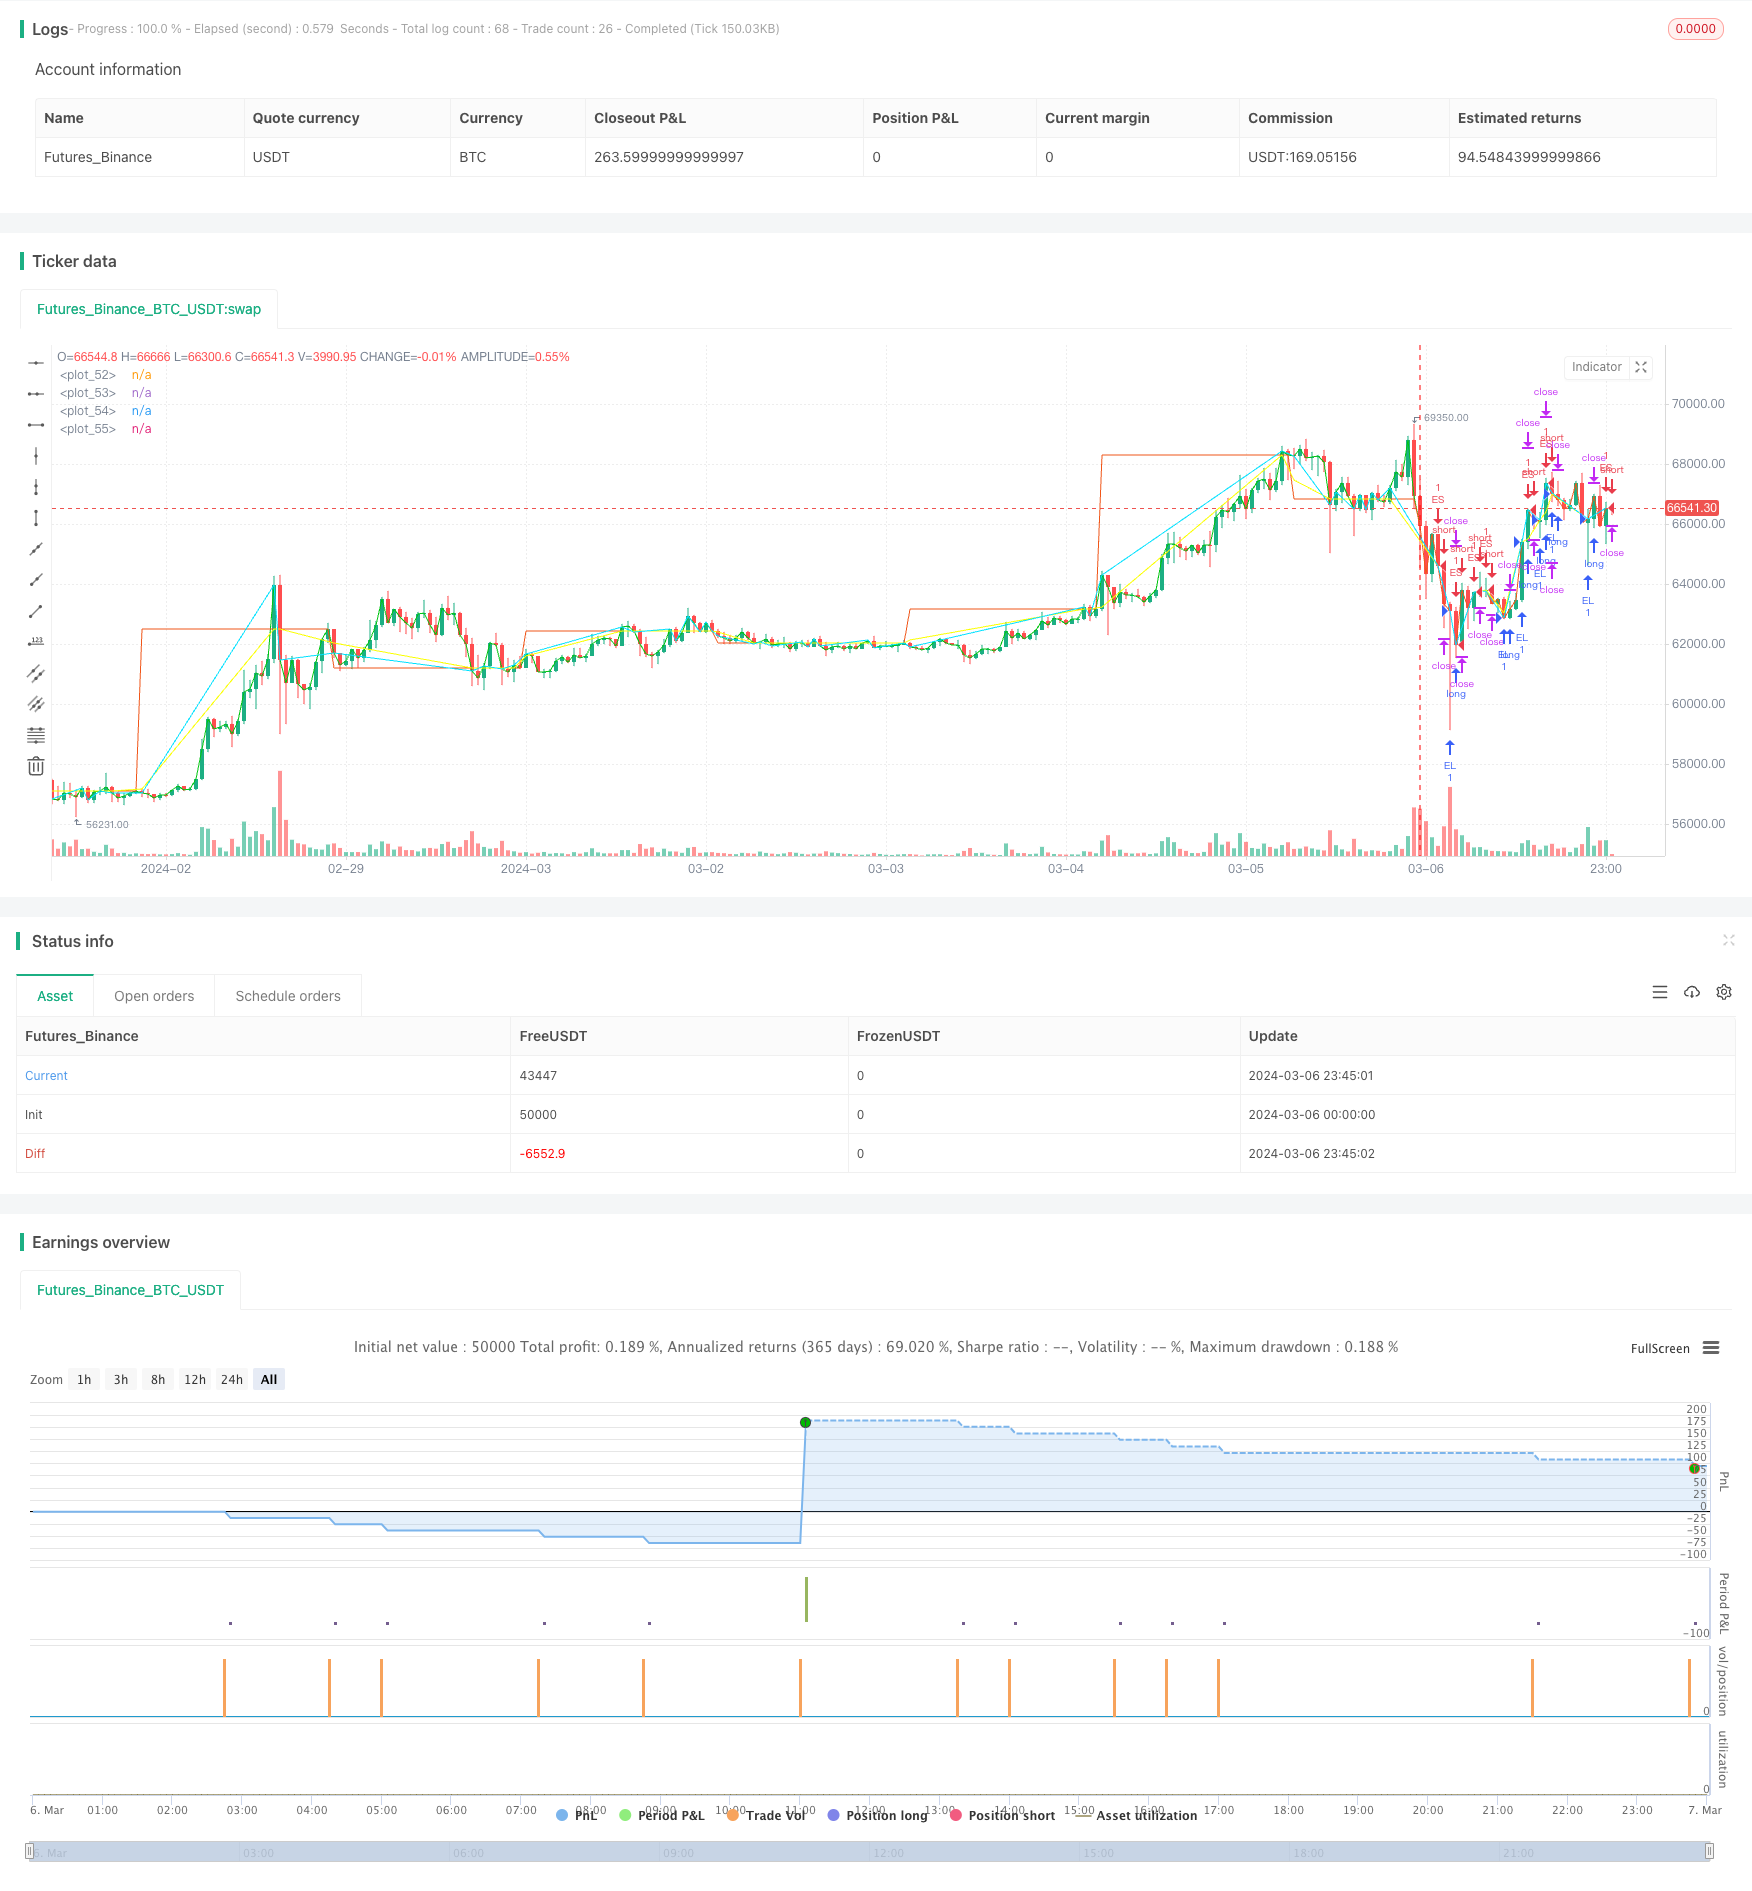
/*backtest
start: 2024-03-06 00:00:00
end: 2024-03-07 00:00:00
period: 45m
basePeriod: 5m
exchanges: [{"eid":"Futures_Binance","currency":"BTC_USDT"}]
*/

//@version=5
strategy('Pine Script Tutorial Example Strategy 1', overlay=true, initial_capital=1000, default_qty_value=100, default_qty_type=strategy.percent_of_equity)
// fastEMA = ta.ema(close, 24)
// slowEMA = ta.ema(close, 200)
// Higher Time Frame
float sl = na
float tgt = na
posSize = 1
vwap_1d = request.security(syminfo.tickerid, "1D", ta.vwap(close))
// plot(vwap_1d)

// To avoid differences on historical and realtime bars, you can use this technique, which only returns a value from the higher timeframe on the bar after it completes:
// indexHighTF = barstate.isrealtime ? 1 : 0
// indexCurrTF = barstate.isrealtime ? 0 : 1
// nonRepaintingVWAP = request.security(syminfo.tickerid, "1D", close[indexHighTF])[indexCurrTF]
// plot(nonRepaintingVWAP, "Non-repainting VWAP")

enterLong = ta.crossover(close, vwap_1d)
exitLong  = ta.crossunder(close, vwap_1d)

enterShort = ta.crossunder(close, vwap_1d)
exitShort  = ta.crossover(close, vwap_1d)

if enterLong
    sl := low[1]>vwap_1d ?low[1]:vwap_1d
    tgt:=close+3
    strategy.entry("EL", strategy.long, qty=posSize)
    strategy.exit('exitEL', 'EL', stop=sl, limit=tgt)
if enterShort
    sl := high[1]<vwap_1d ?high[1]:vwap_1d
    tgt := close-3
    strategy.entry("ES", strategy.short, qty=posSize)
    strategy.exit('exitES', 'ES', stop=sl, limit=tgt)

// if exitLong
//     strategy.close("EL")
// if exitShort
//     strategy.close("ES")


// goLongCondition1 = ta.crossover(close, vwap_1d)
// timePeriod = time >= timestamp(syminfo.timezone, 2021, 01, 01, 0, 0)
// notInTrade = strategy.position_size <= 0
// if goLongCondition1 and timePeriod and notInTrade
//     stopLoss = low[1]
//     takeProfit = close+3
//     strategy.entry('long', strategy.long)
//     strategy.exit('exit', 'long', stop=stopLoss, limit=takeProfit)
plot(close, color=color.new(#00c510, 0))
plot(vwap_1d, color=color.new(#f05619, 0))
plot(sl, color=color.new(#fbff00, 0))
plot(tgt, color=color.new(#00e1ff, 0))