सीवीडी विचलन मात्रात्मक व्यापार रणनीति
रणनीति का सारांश: सीवीडी विचलन मात्रात्मक ट्रेडिंग रणनीति सीवीडी संकेतक और मूल्य विचलन का उपयोग करती है ताकि संभावित रुझान प्रतिगमन संकेतों को पकड़ लिया जा सके। रणनीति सीवीडी संकेतक की गणना करती है और कीमतों के साथ तुलना करके यह निर्धारित करती है कि क्या कोई उछाल या गिरावट का विचलन है। जब कोई विचलन संकेत होता है, तो रणनीति अधिक या खाली हो जाती है। जोखिम को नियंत्रित करने और मुनाफे को लॉक करने के लिए एक चलती स्टॉप और एक निश्चित प्रतिशत स्टॉप का उपयोग करते हुए। रणनीति एक ही समय में कई पदों के लिए पिरामिड को समर्थन देती है।
रणनीतिक सिद्धांत:
- सीवीडी सूचकांक की गणना करेंः सीवीडी सूचकांक और इसके चलती औसत को बहु-मुद्रा और शून्य-मुद्रा के आधार पर गणना करें।
- विचलन की पहचान करेंः सीवीडी सूचकांक के उच्च-नीचे और कीमत के उच्च-नीचे की तुलना करके, यह निर्धारित करें कि क्या विचलन बन रहा है।
- मूल्य नवाचार कम है, लेकिन सीवीडी सूचकांक उच्च और कम है
- छिपे हुए पट्टेबाजों का पलायनः कीमतों में नवाचार उच्च है, लेकिन सीवीडी सूचकांक में अधिक निचले निचले स्तर हैं
- सामान्य गिरावट से दूरः कीमतें उच्च हैं, लेकिन सीवीडी सूचकांक कम ऊंचाइयों का गठन करता है
- छिपी हुई गिरावटः मूल्य नवाचार कम है, लेकिन सीवीडी सूचकांक एक उच्च ऊंचाई बनाता है
- पोजीशन खोलनाः जब पोजीशन खोलने के संकेत की पहचान की जाती है, तो पोजीशन खोलने के प्रकार के आधार पर अधिक या खाली करें।
- स्टॉप लॉस स्टॉपः मोबाइल स्टॉप और फिक्स्ड प्रतिशत स्टॉप का उपयोग करना। स्टॉप लॉस की कीमत स्टॉप लॉस प्रतिशत के आधार पर गणना की जाती है, स्टॉप लॉस की कीमत स्टॉप लॉस प्रतिशत के आधार पर गणना की जाती है।
- पिरामिड बढ़ोतरीः रणनीति में अधिकतम 3 पदों के लिए पिरामिड बढ़ोतरी की अनुमति है
रणनीतिक लाभ:
- रुझान उलटा सिग्नलः सीवीडी विचलन एक प्रभावी रुझान उलटा सिग्नल है जो रुझान उलटा अवसरों को पकड़ने में मदद कर सकता है।
- रुझान निरंतरता सिग्नलः छिपे हुए विचलन एक रुझान निरंतरता सिग्नल के रूप में कार्य करते हैं, जिससे रणनीति को रुझान में सही दिशा में रखने में मदद मिलती है।
- जोखिम नियंत्रणः मोबाइल स्टॉप लॉस और फिक्स्ड प्रतिशत स्टॉप लॉस का उपयोग करके, जोखिम पर प्रभावी नियंत्रण किया जाता है।
- पिरामिडः ट्रेडों का बेहतर लाभ उठाने के लिए कई पदों को अनुमति देता है।
रणनीतिक जोखिमः
- सिग्नल की प्रभावशीलता: सिग्नल से विचलन पूरी तरह से विश्वसनीय नहीं है, कभी-कभी झूठे सिग्नल दिखाई देते हैं।
- पैरामीटर विन्यास: नीति परिणाम पैरामीटर सेटिंग के प्रति संवेदनशील हैं, विभिन्न पैरामीटर अलग-अलग परिणाम दे सकते हैं।
- स्टॉप-लॉस स्लाइडिंग पॉइंटः चरम स्थितियों में, स्टॉप-लॉस ऑर्डर पूर्वनिर्धारित मूल्य पर व्यापार करने में असमर्थ हो सकते हैं, जिससे अतिरिक्त जोखिम होता है।
- ट्रेडिंग शुल्कः अक्सर पोजीशन खोलने से ट्रेडिंग शुल्क अधिक हो सकता है, जिससे रणनीतिक लाभ प्रभावित हो सकता है।
अनुकूलन दिशाः
- गतिशील पैरामीटर अनुकूलनः विभिन्न बाजार स्थितियों के लिए अनुकूलित पैरामीटर का उपयोग करें, संकेत की प्रभावशीलता में सुधार करें।
- अन्य संकेतकों के साथ संयोजनः आरएसआई, एमएसीडी जैसे अन्य तकनीकी संकेतकों के साथ संयोजन, संकेत विश्वसनीयता में सुधार।
- स्टॉप लॉस को बेहतर बनानाः स्टॉप लॉस को रोकने के लिए अधिक उन्नत रणनीतियों का उपयोग करना, जैसे कि स्टॉप को ट्रैक करना, स्टॉप को रोकना, आदि।
- पोजीशन स्केल मैनेजमेंटः बाजार में उतार-चढ़ाव, खाते की पूंजी आदि के आधार पर पोजीशन स्केल को समायोजित करना
संक्षेप में: सीवीडी विचलन क्वांटिफाइंग ट्रेडिंग रणनीति सीवीडी सूचक और मूल्य के विचलन को पकड़ने और संभावित रुझान पलटने के अवसरों की पहचान करने के द्वारा बनाई गई है। साथ ही, मोबाइल स्टॉप लॉस और फिक्स्ड प्रतिशत स्टॉप कंट्रोल जोखिम का उपयोग किया जाता है। रणनीति का मुख्य लाभ यह है कि यह ट्रेंड रिवर्स और स्टॉप सिग्नल को प्रभावी ढंग से पकड़ सकता है, और पिरामिड स्टोरेज के माध्यम से बेहतर प्रवृत्ति स्थिति को पकड़ सकता है। लेकिन इस रणनीति में सिग्नल प्रभावशीलता, पैरामीटर विन्यास, स्टॉप लॉस स्लाइडिंग और ट्रेडिंग शुल्क जैसे जोखिम भी हैं। भविष्य में, गतिशील पैरामीटर अनुकूलन, अन्य संकेतकों के साथ संयोजन, स्टॉप लॉस स्टॉप और ऑर्डर स्केल प्रबंधन जैसे तरीकों से रणनीति के प्रदर्शन को और मजबूत किया जा सकता है। कुल मिलाकर, सीवीडी विचलन रणनीति एक प्रभावी और अनुकूलन योग्य ट्रेंड ट्रेडिंग रणनीति है, जो जोखिम को नियंत्रित करने के साथ-साथ प्रवृत्ति को पकड़ने के अवसरों को मापने वाले व्यापारियों के लिए उपयुक्त है।
/*backtest
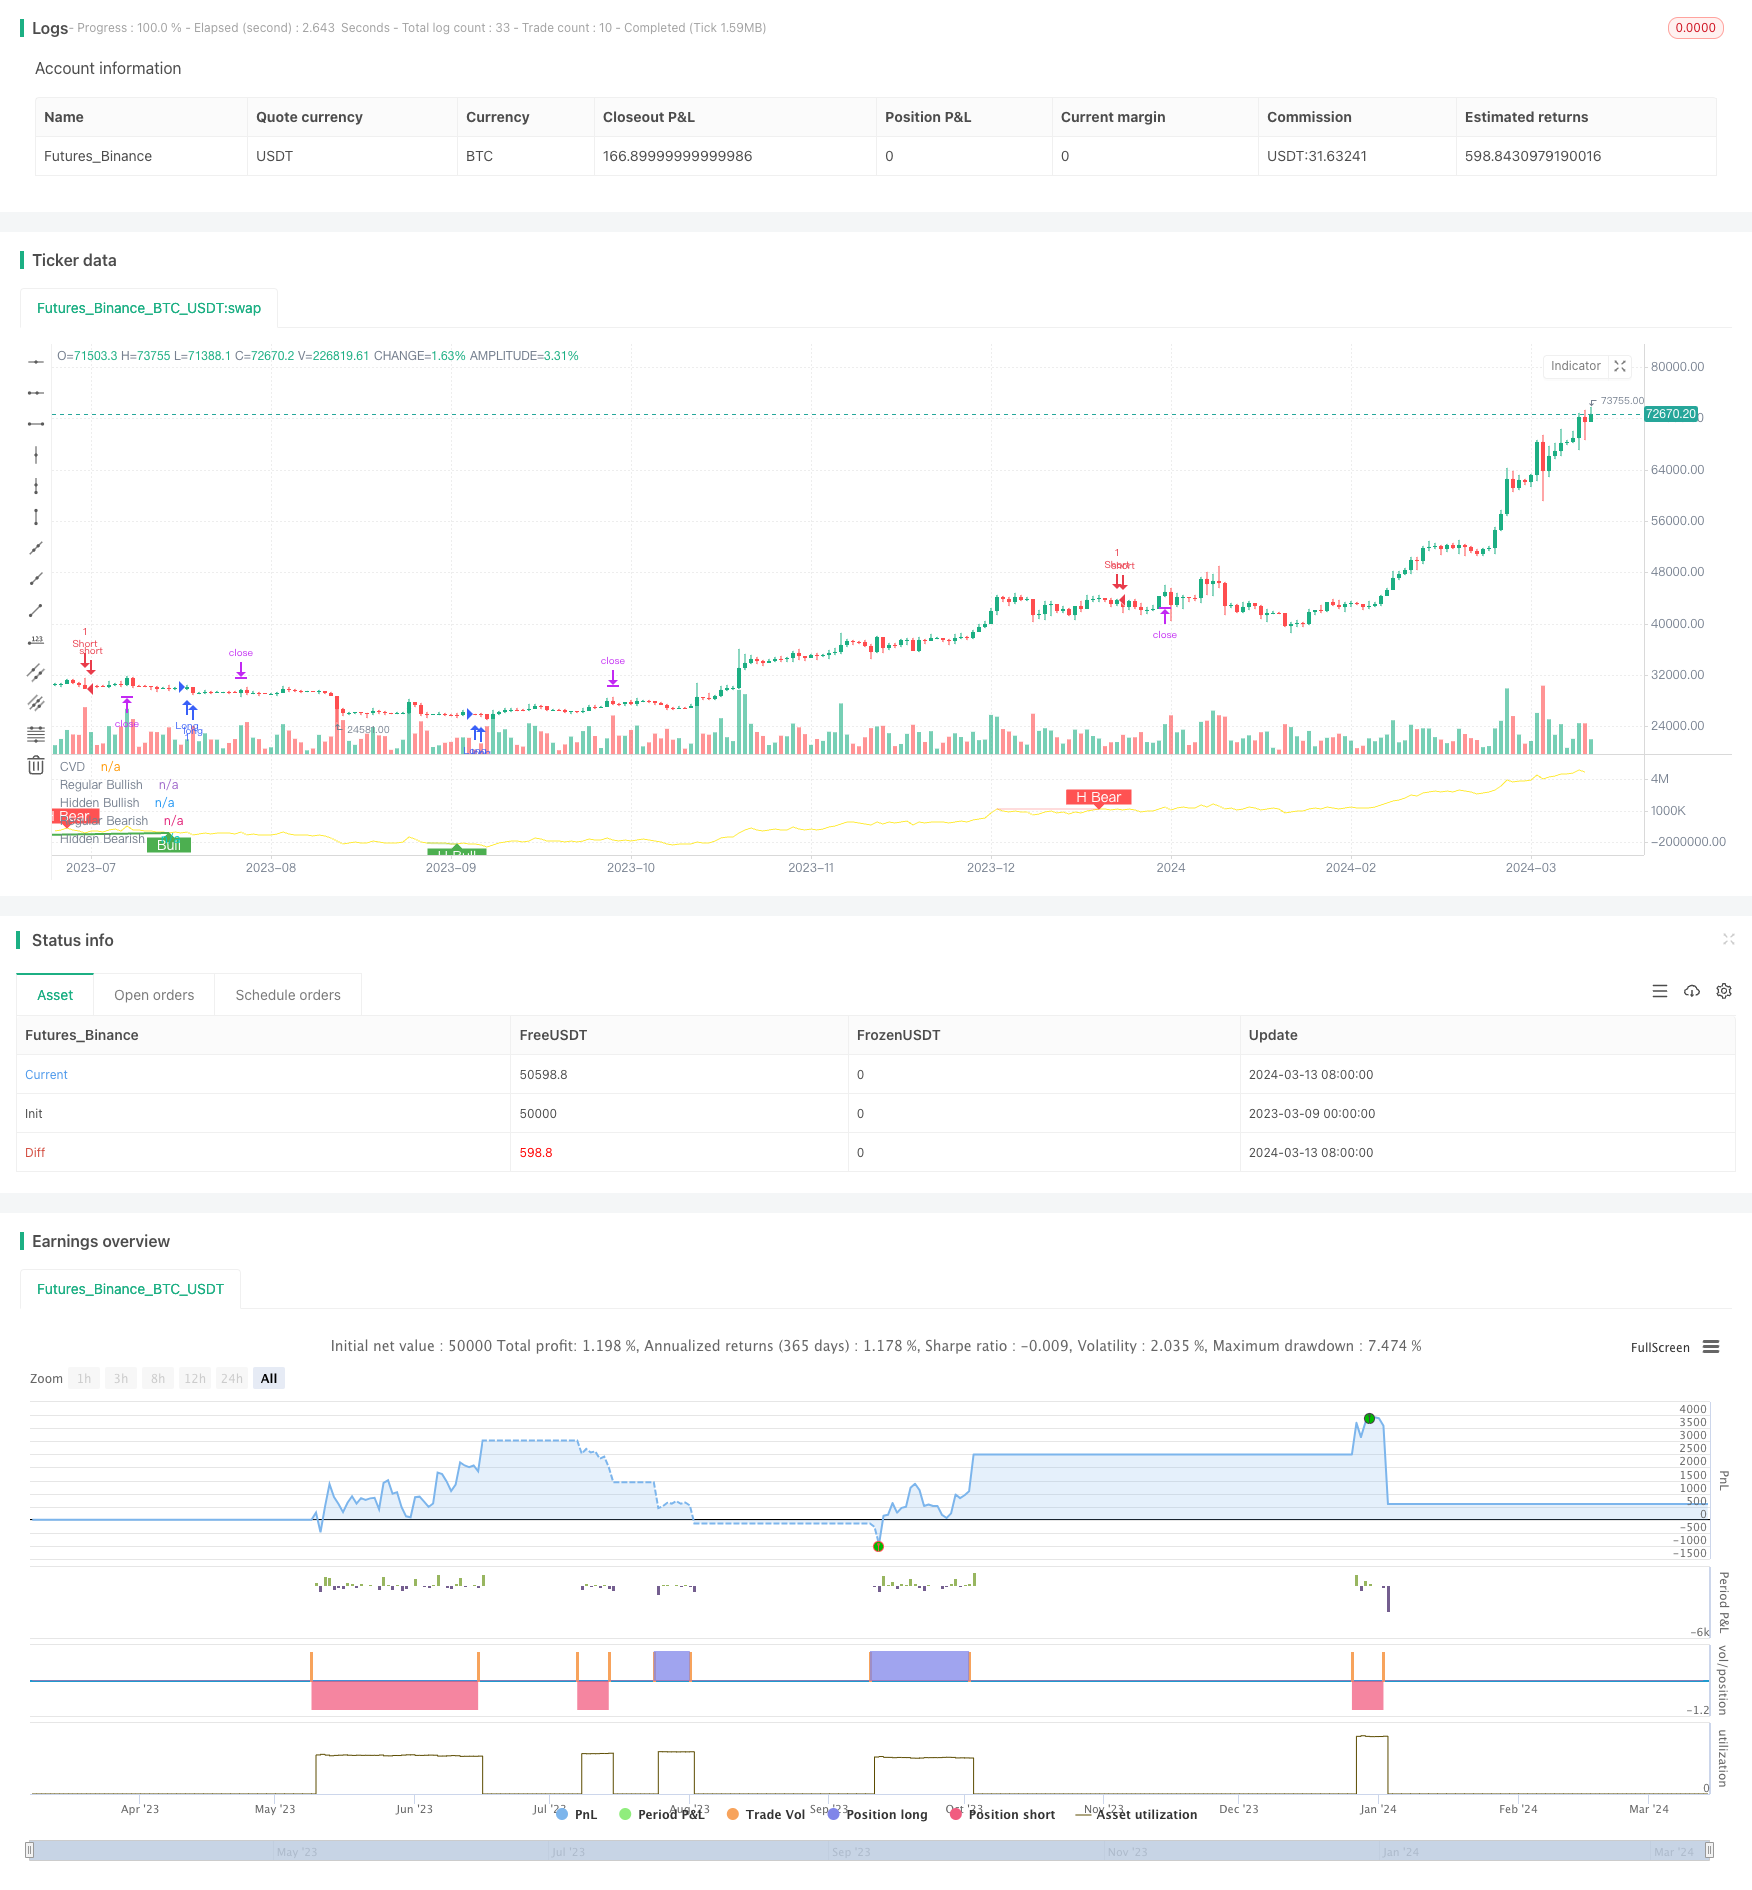
start: 2023-03-09 00:00:00
end: 2024-03-14 00:00:00
period: 1d
basePeriod: 1h
exchanges: [{"eid":"Futures_Binance","currency":"BTC_USDT"}]
*/
// This source code is subject to the terms of the Mozilla Public License 2.0 at https://mozilla.org/MPL/2.0/
//@version=5
//@ mmattman
//Thank you to @ contrerae and Tradingview each for parts of the code to make
//this indicator and matching strategy and also theCrypster for the clean concise TP/SL code.
// indicator(title="CVD Divergence Indicator 1", shorttitle='CVD Div1', format=format.price, timeframe="", timeframe_gaps=true)
strategy("CVD Divergence Strategy.1.mm", shorttitle = 'CVD Div Str 1', overlay=false)
//..................................................................................................................
// Inputs
periodMa = input.int(title='MA Length', minval=1, defval=20)
plotMa = input(title='Plot MA?', defval=false)
// Calculations (Bull & Bear Balance Indicator by Vadim Gimelfarb)
iff_1 = close[1] < open ? math.max(high - close[1], close - low) : math.max(high - open, close - low)
iff_2 = close[1] > open ? high - low : math.max(open - close[1], high - low)
iff_3 = close[1] < open ? math.max(high - close[1], close - low) : high - open
iff_4 = close[1] > open ? high - low : math.max(open - close[1], high - low)
iff_5 = close[1] < open ? math.max(open - close[1], high - low) : high - low
iff_6 = close[1] > open ? math.max(high - open, close - low) : iff_5
iff_7 = high - close < close - low ? iff_4 : iff_6
iff_8 = high - close > close - low ? iff_3 : iff_7
iff_9 = close > open ? iff_2 : iff_8
bullPower = close < open ? iff_1 : iff_9
iff_10 = close[1] > open ? math.max(close[1] - open, high - low) : high - low
iff_11 = close[1] > open ? math.max(close[1] - low, high - close) : math.max(open - low, high - close)
iff_12 = close[1] > open ? math.max(close[1] - open, high - low) : high - low
iff_13 = close[1] > open ? math.max(close[1] - low, high - close) : open - low
iff_14 = close[1] < open ? math.max(open - low, high - close) : high - low
iff_15 = close[1] > open ? math.max(close[1] - open, high - low) : iff_14
iff_16 = high - close < close - low ? iff_13 : iff_15
iff_17 = high - close > close - low ? iff_12 : iff_16
iff_18 = close > open ? iff_11 : iff_17
bearPower = close < open ? iff_10 : iff_18
// Calculations (Bull & Bear Pressure Volume)
bullVolume = bullPower / (bullPower + bearPower) * volume
bearVolume = bearPower / (bullPower + bearPower) * volume
// Calculations Delta
delta = bullVolume - bearVolume
cvd = ta.cum(delta)
cvdMa = ta.sma(cvd, periodMa)
// Plotting
customColor = cvd > cvdMa ? color.new(color.teal, 50) : color.new(color.red, 50)
plotRef1 = plot(cvd, style=plot.style_line, linewidth=1, color=color.new(color.yellow, 0), title='CVD')
plotRef2 = plot(plotMa ? cvdMa : na, style=plot.style_line, linewidth=1, color=color.new(color.white, 0), title='CVD MA')
fill(plotRef1, plotRef2, color=customColor)
//..................................................................................................................
// len = input.int(title="RSI Period", minval=1, defval=14)
// src = input(title="RSI Source", defval=close)
lbR = input(title="Pivot Lookback Right", defval=3)
lbL = input(title="Pivot Lookback Left", defval=7)
rangeUpper = input(title="Max of Lookback Range", defval=60)
rangeLower = input(title="Min of Lookback Range", defval=5)
plotBull = input(title="Plot Bullish", defval=true)
plotHiddenBull = input(title="Plot Hidden Bullish", defval=true)
plotBear = input(title="Plot Bearish", defval=true)
plotHiddenBear = input(title="Plot Hidden Bearish", defval=true)
bearColor = color.red
bullColor = color.green
hiddenBullColor = color.new(color.green, 80)
hiddenBearColor = color.new(color.red, 80)
textColor = color.white
noneColor = color.new(color.white, 100)
osc = cvd
// plot(osc, title="CVD", linewidth=2, color=#2962FF)
// hline(50, title="Middle Line", color=#787B86, linestyle=hline.style_dotted)
// obLevel = hline(70, title="Overbought", color=#787B86, linestyle=hline.style_dotted)
// osLevel = hline(30, title="Oversold", color=#787B86, linestyle=hline.style_dotted)
// fill(obLevel, osLevel, title="Background", color=color.rgb(33, 150, 243, 90))
plFound = na(ta.pivotlow(osc, lbL, lbR)) ? false : true
phFound = na(ta.pivothigh(osc, lbL, lbR)) ? false : true
_inRange(cond) =>
bars = ta.barssince(cond == true)
rangeLower <= bars and bars <= rangeUpper
//------------------------------------------------------------------------------
// Regular Bullish
// Osc: Higher Low
oscHL = osc[lbR] > ta.valuewhen(plFound, osc[lbR], 1) and _inRange(plFound[1])
// Price: Lower Low
priceLL = low[lbR] < ta.valuewhen(plFound, low[lbR], 1)
bullCondAlert = priceLL and oscHL and plFound
bullCond = plotBull and bullCondAlert
plot(
plFound ? osc[lbR] : na,
offset=-lbR,
title="Regular Bullish",
linewidth=2,
color=(bullCond ? bullColor : noneColor)
)
plotshape(
bullCond ? osc[lbR] : na,
offset=-lbR,
title="Regular Bullish Label",
text=" Bull ",
style=shape.labelup,
location=location.absolute,
color=bullColor,
textcolor=textColor
)
//------------------------------------------------------------------------------
// Hidden Bullish
// Osc: Lower Low
oscLL = osc[lbR] < ta.valuewhen(plFound, osc[lbR], 1) and _inRange(plFound[1])
// Price: Higher Low
priceHL = low[lbR] > ta.valuewhen(plFound, low[lbR], 1)
hiddenBullCondAlert = priceHL and oscLL and plFound
hiddenBullCond = plotHiddenBull and hiddenBullCondAlert
plot(
plFound ? osc[lbR] : na,
offset=-lbR,
title="Hidden Bullish",
linewidth=2,
color=(hiddenBullCond ? hiddenBullColor : noneColor)
)
plotshape(
hiddenBullCond ? osc[lbR] : na,
offset=-lbR,
title="Hidden Bullish Label",
text=" H Bull ",
style=shape.labelup,
location=location.absolute,
color=bullColor,
textcolor=textColor
)
//------------------------------------------------------------------------------
// Regular Bearish
// Osc: Lower High
oscLH = osc[lbR] < ta.valuewhen(phFound, osc[lbR], 1) and _inRange(phFound[1])
// Price: Higher High
priceHH = high[lbR] > ta.valuewhen(phFound, high[lbR], 1)
bearCondAlert = priceHH and oscLH and phFound
bearCond = plotBear and bearCondAlert
plot(
phFound ? osc[lbR] : na,
offset=-lbR,
title="Regular Bearish",
linewidth=2,
color=(bearCond ? bearColor : noneColor)
)
plotshape(
bearCond ? osc[lbR] : na,
offset=-lbR,
title="Regular Bearish Label",
text=" Bear ",
style=shape.labeldown,
location=location.absolute,
color=bearColor,
textcolor=textColor
)
//------------------------------------------------------------------------------
// Hidden Bearish
// Osc: Higher High
oscHH = osc[lbR] > ta.valuewhen(phFound, osc[lbR], 1) and _inRange(phFound[1])
// Price: Lower High
priceLH = high[lbR] < ta.valuewhen(phFound, high[lbR], 1)
hiddenBearCondAlert = priceLH and oscHH and phFound
hiddenBearCond = plotHiddenBear and hiddenBearCondAlert
plot(
phFound ? osc[lbR] : na,
offset=-lbR,
title="Hidden Bearish",
linewidth=2,
color=(hiddenBearCond ? hiddenBearColor : noneColor)
)
plotshape(
hiddenBearCond ? osc[lbR] : na,
offset=-lbR,
title="Hidden Bearish Label",
text=" H Bear ",
style=shape.labeldown,
location=location.absolute,
color=bearColor,
textcolor=textColor
)
// alertcondition(bullCondAlert, title='Regular Bullish CVD Divergence', message="Found a new Regular Bullish Divergence, `Pivot Lookback Right` number of bars to the left of the current bar")
// alertcondition(hiddenBullCondAlert, title='Hidden Bullish CVD Divergence', message='Found a new Hidden Bullish Divergence, `Pivot Lookback Right` number of bars to the left of the current bar')
// alertcondition(bearCondAlert, title='Regular Bearish CVD Divergence', message='Found a new Regular Bearish Divergence, `Pivot Lookback Right` number of bars to the left of the current bar')
// alertcondition(hiddenBearCondAlert, title='Hidden Bearisn CVD Divergence', message='Found a new Hidden Bearisn Divergence, `Pivot Lookback Right` number of bars to the left of the current bar')
le = bullCondAlert or hiddenBullCondAlert
se = bearCondAlert or hiddenBearCondAlert
ltp = se
stp = le
// Check if the entry conditions for a long position are met
if (le) //and (close > ema200)
strategy.entry("Long", strategy.long, comment="EL")
// Check if the entry conditions for a short position are met
if (se) //and (close < ema200)
strategy.entry("Short", strategy.short, comment="ES")
// Close long position if exit condition is met
if (ltp) // or (close < ema200)
strategy.close("Long", comment="XL")
// Close short position if exit condition is met
if (stp) //or (close > ema200)
strategy.close("Short", comment="XS")
// The Fixed Percent Stop Loss Code
// User Options to Change Inputs (%)
stopPer = input.float(5.0, title='Stop Loss %') / 100
takePer = input.float(10.0, title='Take Profit %') / 100
// Determine where you've entered and in what direction
longStop = strategy.position_avg_price * (1 - stopPer)
shortStop = strategy.position_avg_price * (1 + stopPer)
shortTake = strategy.position_avg_price * (1 - takePer)
longTake = strategy.position_avg_price * (1 + takePer)
if strategy.position_size > 0
strategy.exit("Close Long", "Long", stop=longStop, limit=longTake)
if strategy.position_size < 0
strategy.exit("Close Short", "Short", stop=shortStop, limit=shortTake)