मोमेंटम ट्रेडिंग: डबल मूविंग एवरेज क्रॉसओवर रणनीति

अवलोकन
यह रणनीति 8 चक्रों और 21 चक्रों की सूचकांक चलती औसत (ईएमए) का उपयोग करती है ताकि बाजार की प्रवृत्ति में परिवर्तन की पहचान की जा सके। जब कम अवधि का ईएमए नीचे से लंबी अवधि के ईएमए को पार करता है, तो एक खरीद संकेत उत्पन्न होता है; इसके विपरीत, जब कम अवधि का ईएमए ऊपर से लंबी अवधि के ईएमए को पार करता है, तो एक बेचने का संकेत उत्पन्न होता है। यह रणनीति तीन लगातार उच्चतम निचले (एचएलएल) और तीन लगातार कम ऊंचाई (एलएलएच) को जोड़ती है, जो आगे की प्रवृत्ति में बदलाव की पुष्टि करती है। इसके अलावा, यह रणनीति जोखिम को नियंत्रित करने और मुनाफे को लॉक करने के लिए स्टॉप-लॉस और स्टॉप-होल्ड स्तर भी निर्धारित करती है।
रणनीति सिद्धांत
- मुख्य प्रवृत्ति दिशाओं की पहचान करने के लिए 8 चक्र और 21 चक्र ईएमए की गणना करें।
- तीन लगातार उच्चतम निचले स्तरों (HLL) और तीन लगातार निम्नतम उच्चतम ऊंचाई (LLH) की पहचान करें, जो प्रवृत्ति में बदलाव के लिए एक प्रारंभिक संकेत है।
- जब 8 चक्र ईएमए नीचे से 21 चक्र ईएमए को पार करता है, और एचएलएल के माध्यम से एक खरीद संकेत उत्पन्न करता है; जब 8 चक्र ईएमए ऊपर से 21 चक्र ईएमए को पार करता है, और एलएलएच के माध्यम से एक बिक्री संकेत उत्पन्न करता है।
- जोखिम को नियंत्रित करने और मुनाफे को लॉक करने के लिए स्टॉप-लॉस स्तर को प्रवेश मूल्य का 5% और स्टॉप-ऑफ स्तर को प्रवेश मूल्य का 16% पर सेट करें।
- जब रिवर्स सिग्नल आता है, तो स्थिति को बंद करें और रिवर्स खोलें।
रणनीतिक लाभ
- ईएमए और मूल्य व्यवहार पैटर्न (एचएलएल और एलएलएच) के साथ संयोजन में प्रवृत्ति की पुष्टि करने के लिए, सिग्नल विश्वसनीयता में सुधार।
- जोखिम को नियंत्रित करने और मुनाफे को लॉक करने में मदद करने के लिए स्पष्ट स्टॉप-लॉस और स्टॉप-ऑफ स्तर सेट करें।
- विभिन्न समय-सीमाओं और विभिन्न बाजारों के लिए लागू, कुछ सार्वभौमिकता के साथ।
- तर्क स्पष्ट है, इसे समझना और लागू करना आसान है।
रणनीतिक जोखिम
- अस्थिर बाजारों में, बार-बार क्रॉसिंग के परिणामस्वरूप कई बार झूठे संकेत हो सकते हैं, जिससे नुकसान होता है।
- निश्चित स्टॉप और स्टॉप-ऑफ स्तरों को विभिन्न बाजार स्थितियों के लिए अनुकूलित नहीं किया जा सकता है, जिससे संभावित अवसर लागत या अधिक नुकसान हो सकता है।
- रणनीति ऐतिहासिक आंकड़ों पर निर्भर करती है और आकस्मिक घटनाओं या मौलिक परिवर्तनों के लिए कम अनुकूल हो सकती है।
रणनीति अनुकूलन दिशा
- अनुकूली स्टॉप और स्टॉप तंत्र की शुरूआत, जैसे कि अस्थिरता के आधार पर (जैसे एटीआर) स्टॉप और स्टॉप स्तर को समायोजित करने के लिए, विभिन्न बाजार स्थितियों के लिए बेहतर अनुकूलन के लिए।
- अन्य संकेतकों या कारकों के साथ संयोजन में, जैसे कि लेनदेन की मात्रा, सापेक्ष ताकत सूचकांक (आरएसआई), आदि, सिग्नल को और अधिक फ़िल्टर करने और विश्वसनीयता बढ़ाने के लिए।
- पैरामीटर (जैसे ईएमए चक्र, स्टॉप-स्टॉप अनुपात, आदि) का अनुकूलन करें और किसी विशेष बाजार या मानक पर सबसे अच्छा प्रदर्शन करने वाले पैरामीटर का संयोजन ढूंढें।
- जोखिम प्रबंधन के उपायों को लागू करने पर विचार करें, जैसे कि स्थिति आकार, एकल व्यापार के जोखिम को नियंत्रित करने के लिए।
संक्षेप
यह रणनीति 8 चक्र और 21 चक्र ईएमए के क्रॉसिंग का उपयोग करती है, एचएलएल और एलएलएच मूल्य मॉडल के संयोजन के साथ, ट्रेंड रिवर्स की पहचान करने और ट्रेडिंग सिग्नल उत्पन्न करने के लिए। स्पष्ट स्टॉप लॉस नियम जोखिम को नियंत्रित करने और मुनाफे को लॉक करने में मदद करते हैं। हालांकि, यह रणनीति अस्थिर बाजारों में झूठे सिग्नल का उत्पादन कर सकती है, और निश्चित स्टॉप लॉस स्तर अलग-अलग बाजारों के अनुकूल नहीं हो सकते हैं। आगे के सुधार के लिए, अनुकूलन स्टॉप लॉस, अन्य संकेतकों के संयोजन, ऑप्टिमाइज़ेशन पैरामीटर और जोखिम प्रबंधन उपायों की शुरूआत को शामिल करने पर विचार किया जा सकता है। कुल मिलाकर, यह रणनीति गतिशीलता और ट्रेंड ट्रैकिंग पर आधारित ट्रेडिंग फ्रेमवर्क प्रदान करती है, लेकिन अभी भी विशिष्ट बाजारों और व्यक्तिगत वरीयताओं के अनुसार समायोजन और अनुकूलन की आवश्यकता है।
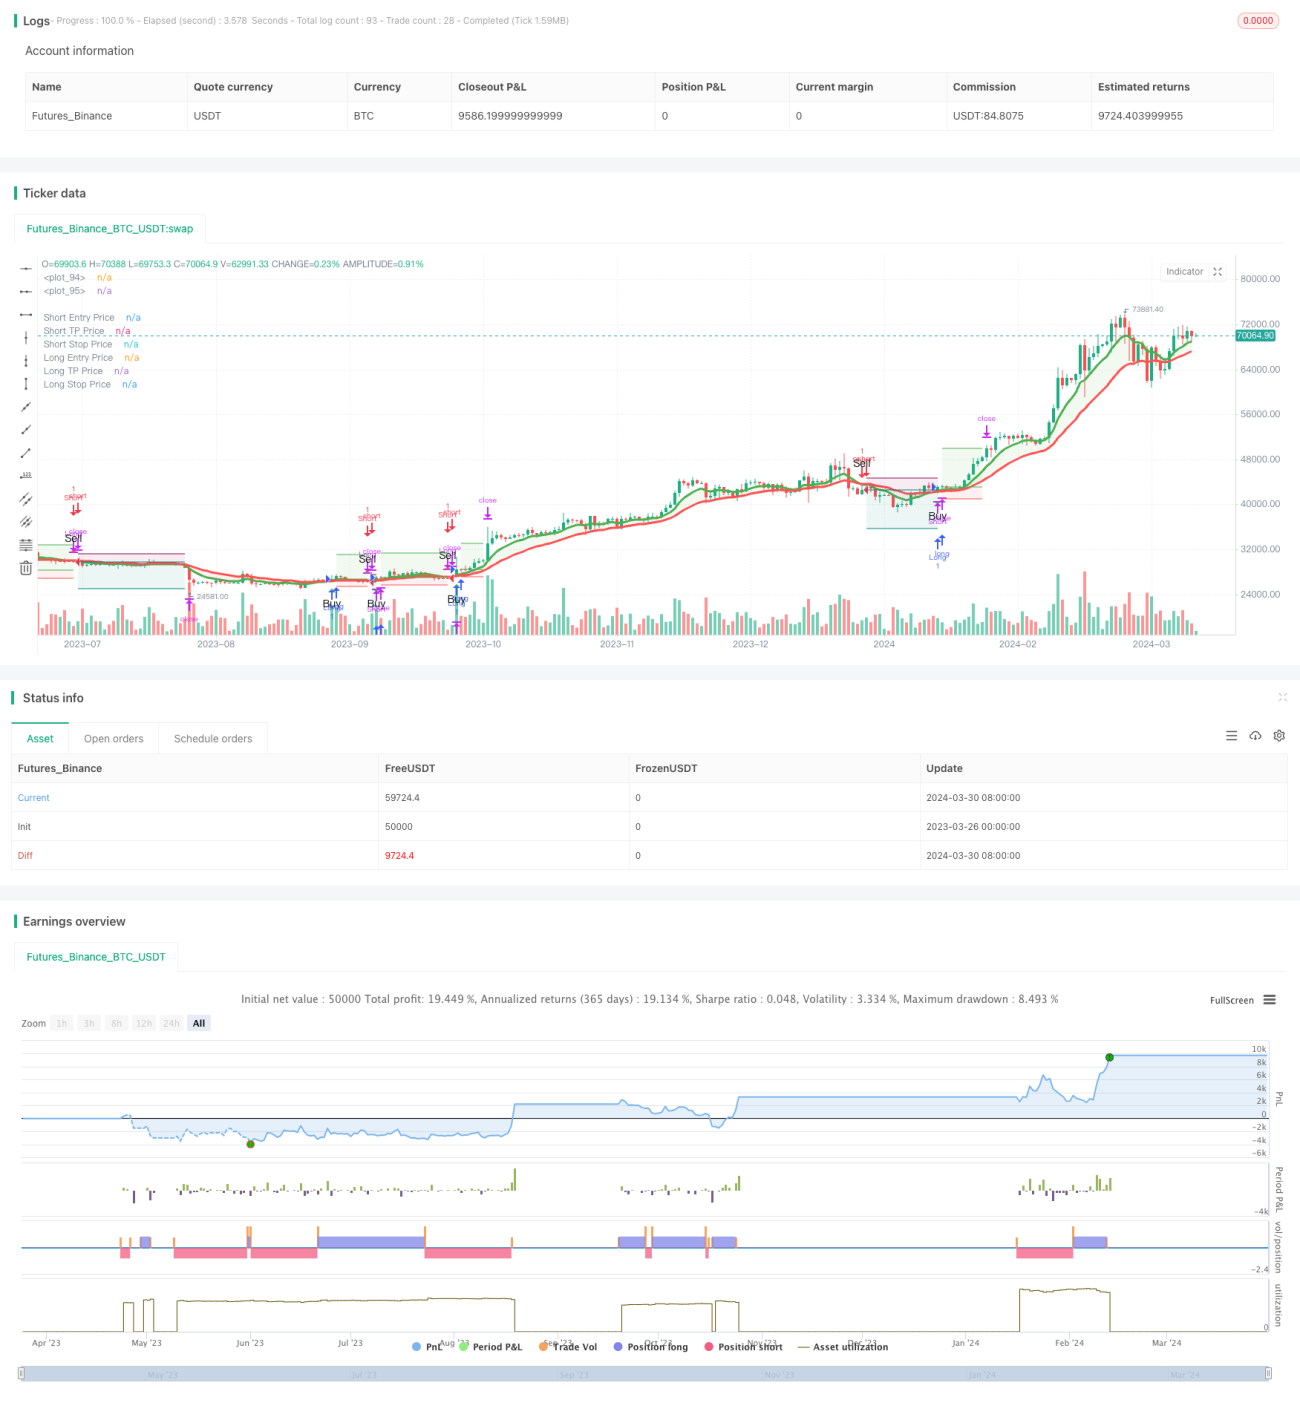
/*backtest
start: 2023-03-26 00:00:00
end: 2024-03-31 00:00:00
period: 1d
basePeriod: 1h
exchanges: [{"eid":"Futures_Binance","currency":"BTC_USDT"}]
*/

//@version=5
strategy('Trend Following 8&21EMA with strategy tester [ukiuro7]', overlay=true, process_orders_on_close=true, calc_on_every_tick=true, initial_capital = 10000)

//INPUTS- 1