
अवलोकन
यह रणनीति आरएसआई को चलती औसत (एमए) के साथ जोड़ती है ताकि ट्रेडिंग सिग्नल उत्पन्न किया जा सके। आरएसआई का उपयोग यह निर्धारित करने के लिए किया जाता है कि बाजार ओवरबॉय या ओवरसोल्ड है या नहीं, और एमए का उपयोग मूल्य प्रवृत्ति का आकलन करने के लिए किया जाता है। जब आरएसआई ओवरबॉय होता है और एमए से अधिक कीमत होती है तो यह एक खरीद संकेत उत्पन्न करता है; जब आरएसआई ओवरसोल्ड होता है या एमए एक डेड फोर्क उत्पन्न करता है तो यह एक बिक्री संकेत उत्पन्न करता है। इसके अलावा, रणनीति में एक यादृच्छिक आरएसआई सूचक (स्टोच आरएसआई) को एक सहायक निर्णय के रूप में पेश किया गया है, जो स्टोच आरएसआई के संकेत के रूप में चार्ट पर संकेत देता है।
रणनीति सिद्धांत
- आरएसआई सूचकांक के मूल्य की गणना करें, यह निर्धारित करने के लिए कि क्या बाजार ओवरबॉय (<70) या ओवरसोल्ड (<30) है।
- चार प्रकार के ईएमए, एसएमए, एचएमए और डब्ल्यूएमए सहित कस्टम चक्र एमए की गणना करें और पैरामीटर सेटिंग के आधार पर तय करें कि क्या यह चार्ट पर दिखाई देगा।
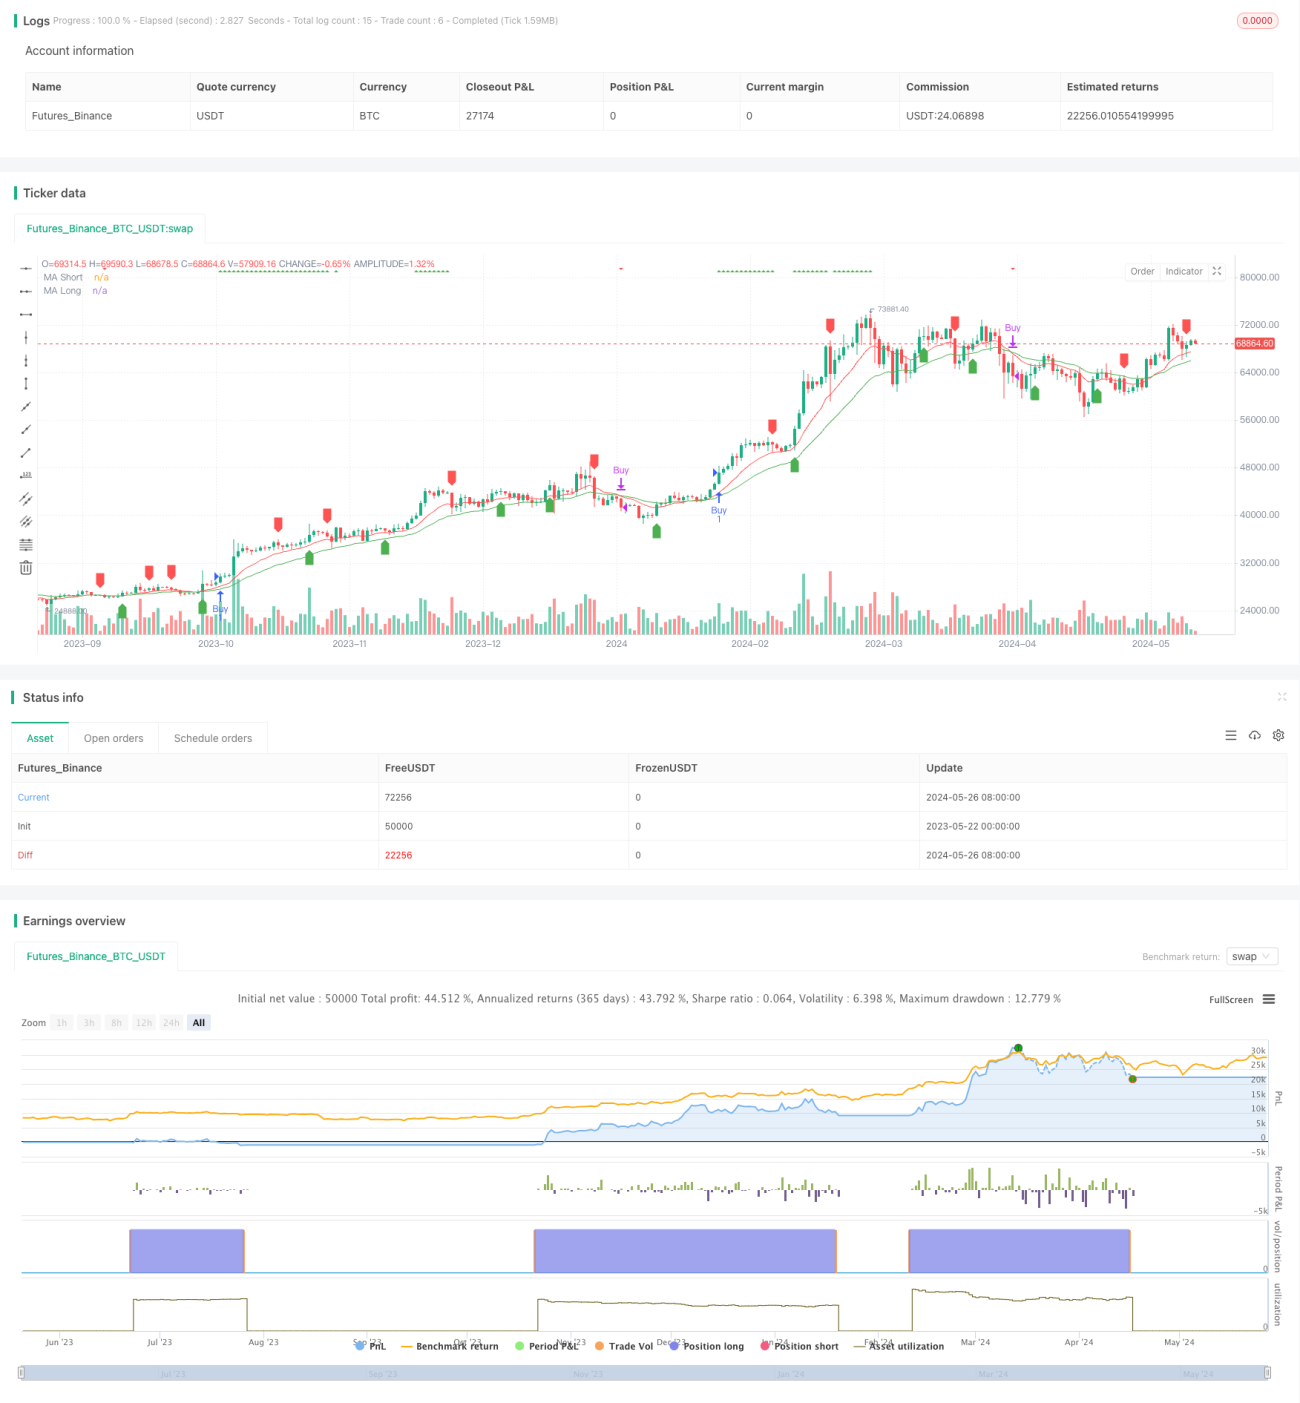
- जब आरएसआई ओवरबॉय करता है और एमए से ऊपर बंद होता है, तो एक खरीद संकेत उत्पन्न होता है; जब आरएसआई ओवरबॉय करता है या एमए डेड फोर्क उत्पन्न करता है, तो एक बेचने का संकेत उत्पन्न होता है।
- स्टोचआरएसआई को एक सहायक निर्णय के रूप में पेश किया गया है, स्टोचआरएसआई ओवरबॉट ((> 70) या ओवरबॉट ((< 30) पर चार्ट पर संकेत देता है, लेकिन वास्तविक व्यापार संकेत नहीं देता है।
रणनीतिक लाभ
- आरएसआई और एमए, दो क्लासिक संकेतकों का एक संगठित संयोजन, बेहतर ट्रेंडिंग स्थिति और ओवरबॉट और ओवरसोल्ड समय को पकड़ने में सक्षम है।
- एमए प्रकार और मापदंडों को स्वतंत्र रूप से सेट किया जा सकता है, उच्च लचीलापन, विभिन्न बाजार विशेषताओं के अनुसार समायोजित किया जा सकता है।
- स्टोच आरएसआई को एक सहायक निर्णय के रूप में पेश किया गया है, जो व्यापारिक निर्णयों के लिए अधिक संदर्भ प्रदान करता है।
- कोड तर्क स्पष्ट है, पठनीय है, समझने और पुनः उपयोग करने में आसान है।
रणनीतिक जोखिम
- आरएसआई और एमए दोनों ही पिछड़े संकेत हैं, जो रुझान में बदलाव की शुरुआत में अधिक भ्रामक संकेत दे सकते हैं।
- गलत पैरामीटर सेटिंग से सिग्नल बहुत जल्दी या बहुत देर से आ सकता है, जिससे समग्र लाभ प्रभावित हो सकता है।
- स्टॉप लॉस और पोजीशन मैनेजमेंट का अभाव, बाजार में भारी उतार-चढ़ाव के दौरान अधिक जोखिम उठा सकता है।
रणनीति अनुकूलन दिशा
- अधिक अग्रिम संकेतकों जैसे कि उतार-चढ़ाव की दर को पेश करना, जो रुझान में बदलाव का आकलन करने में मदद करता है।
- खरीद और बिक्री संकेतों को फ़िल्टर करें, जैसे कि आरएसआई और एमए को एक साथ कुछ शर्तों को पूरा करने के लिए संकेत उत्पन्न करना, ताकि संकेत की सटीकता में सुधार हो सके।
- स्टॉप लॉस और पोजीशन मैनेजमेंट मॉड्यूल को रणनीति में शामिल करना, जो एकल व्यापार जोखिम और समग्र जोखिम को नियंत्रित करता है।
- रणनीति के लिए पैरामीटर अनुकूलन, सबसे अच्छा पैरामीटर संयोजन खोजने के लिए।
- विभिन्न चक्रों या कई किस्मों को शामिल करने पर विचार करें, और विभिन्न किस्मों या चक्रों के बीच संबंधों का पूरा लाभ उठाएं।
संक्षेप
इस रणनीति में RSI और MA दो क्लासिक संकेतक के संयोजन के माध्यम से, ट्रेंडिंग ट्रेंड और ओवरबॉट ओवरबॉट समय को पकड़ने में सक्षम है, जबकि स्टोचआरएसआई संकेतक को सहायक निर्णय के रूप में पेश किया गया है, समग्र विचार सरल और स्पष्ट है। लेकिन रणनीति में कुछ कमियां भी हैं, जैसे कि जोखिम नियंत्रण उपायों की कमी, संकेत सटीकता में सुधार करना है। भविष्य में, अधिक संकेतक, अनुकूलित संकेत नियम, जोखिम नियंत्रण मॉड्यूल आदि को शामिल करने के लिए रणनीति को बेहतर बनाया जा सकता है, ताकि अधिक स्थिर लाभ प्राप्त किया जा सके।
- 1