जी ट्रेंड ईएमए एटीआर स्मार्ट ट्रेडिंग रणनीति

अवलोकन
इस रणनीति का मुख्य विचार यह है कि जब कीमत G चैनल को तोड़ती है और ईएमए के नीचे अधिक करती है, तो यह G चैनल को तोड़ती है और ईएमए के ऊपर खाली होती है। साथ ही, एटीआर का उपयोग गतिशील स्टॉप और स्टॉप स्थानों को स्थापित करने के लिए किया जाता है, स्टॉप 2 गुना एटीआर और स्टॉप 4 गुना एटीआर। इस तरह से ट्रेंडिंग स्थिति में अधिक मुनाफा कमाया जा सकता है, जबकि जोखिम को सख्ती से नियंत्रित किया जाता है।
रणनीति सिद्धांत
- चैनल जी के ऊपर-नीचे की गणना करेंः वर्तमान समापन मूल्य और पिछले उच्चतम मूल्य के न्यूनतम मूल्य का उपयोग करके चैनल जी के ऊपर-नीचे की गणना करें।
- प्रवृत्ति की दिशा का न्याय करना: मूल्य और जी चैनल के ऊपर और नीचे के संबंधों को देखकर बहुआयामी प्रवृत्ति का न्याय करना
- ईएमए की गणना करेंः निर्दिष्ट अवधि के ईएमए मूल्य की गणना करें
- एटीआर की गणना करेंः निर्दिष्ट अवधि के एटीआर मान की गणना करें।
- खरीद-बिक्री की शर्तों को निर्धारित करनाः जब कीमत G चैनल को पार करती है और ईएमए से नीचे होती है तो अधिक करें, और जब यह नीचे की ओर और ईएमए से ऊपर होती है तो शून्य करें।
- स्टॉप लॉस स्टॉप सेट करेंः स्टॉप लॉस स्टॉप-ऑफ-पॉजिशन मूल्य - 2 गुना एटीआर, स्टॉप लॉस स्टॉप-ऑफ-पॉजिशन मूल्य + 4 गुना एटीआर (बहु-हेड); स्टॉप लॉस स्टॉप-ऑफ-पॉजिशन मूल्य + 2 गुना एटीआर, स्टॉप लॉस स्टॉप-ऑफ-पॉजिशन मूल्य - 4 गुना एटीआर (खाली) ।
- रणनीति ट्रिगरः खरीद और बिक्री की शर्तों को पूरा करने के लिए एक स्टॉप-लॉस स्टॉप सेट करें।
रणनीतिक लाभ
- ट्रेंड ट्रैकिंगः बाजार की प्रवृत्तियों को प्रभावी ढंग से पकड़ने के लिए G चैनल का उपयोग करने की रणनीति, जो ट्रेंडिंग स्थितियों के लिए उपयुक्त है।
- गतिशील स्टॉप-लॉसः एटीआर का उपयोग करके गतिशील स्टॉप-लॉस को समायोजित करें, ताकि बाजार में उतार-चढ़ाव के लिए बेहतर अनुकूल हो सके।
- जोखिम नियंत्रणः स्टॉप-लॉस को 2 गुना एटीआर पर सेट किया गया है, जो प्रत्येक ट्रेड के जोखिम को सख्ती से नियंत्रित करता है।
- सरल और उपयोग में आसानः रणनीति का तर्क स्पष्ट है और अधिकांश निवेशकों के लिए उपयुक्त है।
रणनीतिक जोखिम
- अस्थिरता: अस्थिरता वाले बाजारों में, बार-बार ट्रेडिंग सिग्नल से नुकसान बढ़ सकता है।
- पैरामीटर अनुकूलनः विभिन्न किस्मों और चक्रों के लिए अलग-अलग पैरामीटर की आवश्यकता हो सकती है, और अंधाधुंध उपयोग जोखिम पैदा कर सकता है।
- ब्लैक स्वान घटनाः चरम स्थितियों में, कीमतों में भारी उतार-चढ़ाव होता है, और रोक को प्रभावी ढंग से लागू नहीं किया जा सकता है।
रणनीति अनुकूलन दिशा
- रुझान फ़िल्टरिंगः रुझान फ़िल्टरिंग शर्तों को जोड़ें, जैसे कि एमए क्रॉसिंग, डीएमआई, आदि, और अस्थिर स्थिति में व्यापार को कम करें।
- पैरामीटर अनुकूलन: विभिन्न किस्मों और चक्रों के लिए पैरामीटर अनुकूलन करें, सबसे अच्छा पैरामीटर संयोजन ढूंढें।
- पोजीशन मैनेजमेंटः बाजार की अस्थिरता के अनुसार पोजीशन को समायोजित करें, धन के उपयोग की दर में सुधार करें।
- संयोजन रणनीति: स्थिरता को बढ़ाने के लिए अन्य प्रभावी रणनीतियों के साथ संयोजन।
संक्षेप
रणनीति जी चैनल, ईएमए, एटीआर और अन्य संकेतकों के माध्यम से एक सरल और प्रभावी ट्रेंड ट्रैकिंग ट्रेडिंग सिस्टम का निर्माण करती है। यह प्रवृत्ति में अच्छा प्रभाव डाल सकता है, लेकिन यह आमतौर पर अशांति में प्रदर्शन करता है। रणनीति को प्रवृत्ति फ़िल्टर, पैरामीटर अनुकूलन, स्थिति प्रबंधन, संयोजन रणनीति आदि से अनुकूलित किया जा सकता है, ताकि रणनीति की स्थिरता और लाभप्रदता को और बढ़ाया जा सके।
/*backtest
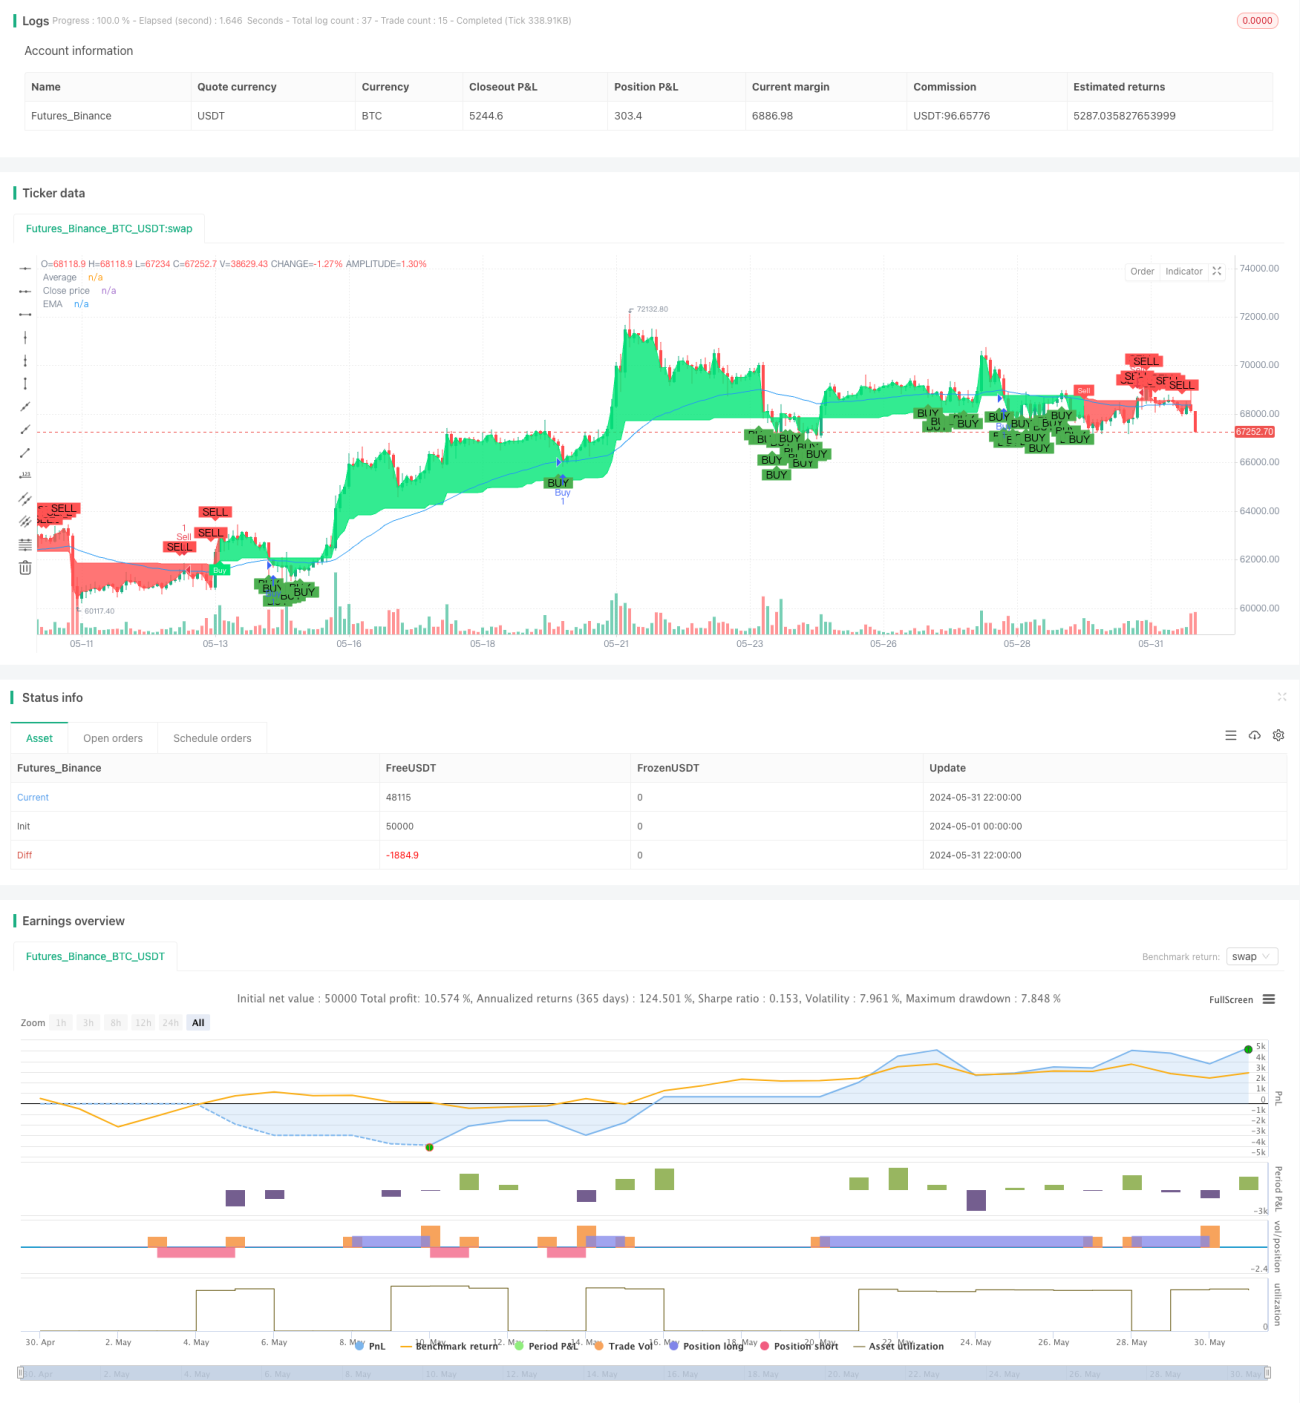
start: 2024-05-01 00:00:00
end: 2024-05-31 23:59:59
period: 2h
basePeriod: 15m
exchanges: [{"eid":"Futures_Binance","currency":"BTC_USDT"}]
*/
//@version=4
// Full credit to AlexGrover: https://www.tradingview.com/script/fIvlS64B-G-Channels-Efficient-Calculation-Of-Upper-Lower-Extremities/
strategy ("G-Channel Trend Detection with EMA Strategy and ATR", shorttitle="G-Trend EMA ATR Strategy", overlay=true)
- 1