मल्टी-पीरियड आरएसआई मोमेंटम और ट्रिपल ईएमए ट्रेंड फॉलोइंग कम्पोजिट रणनीति

अवलोकन
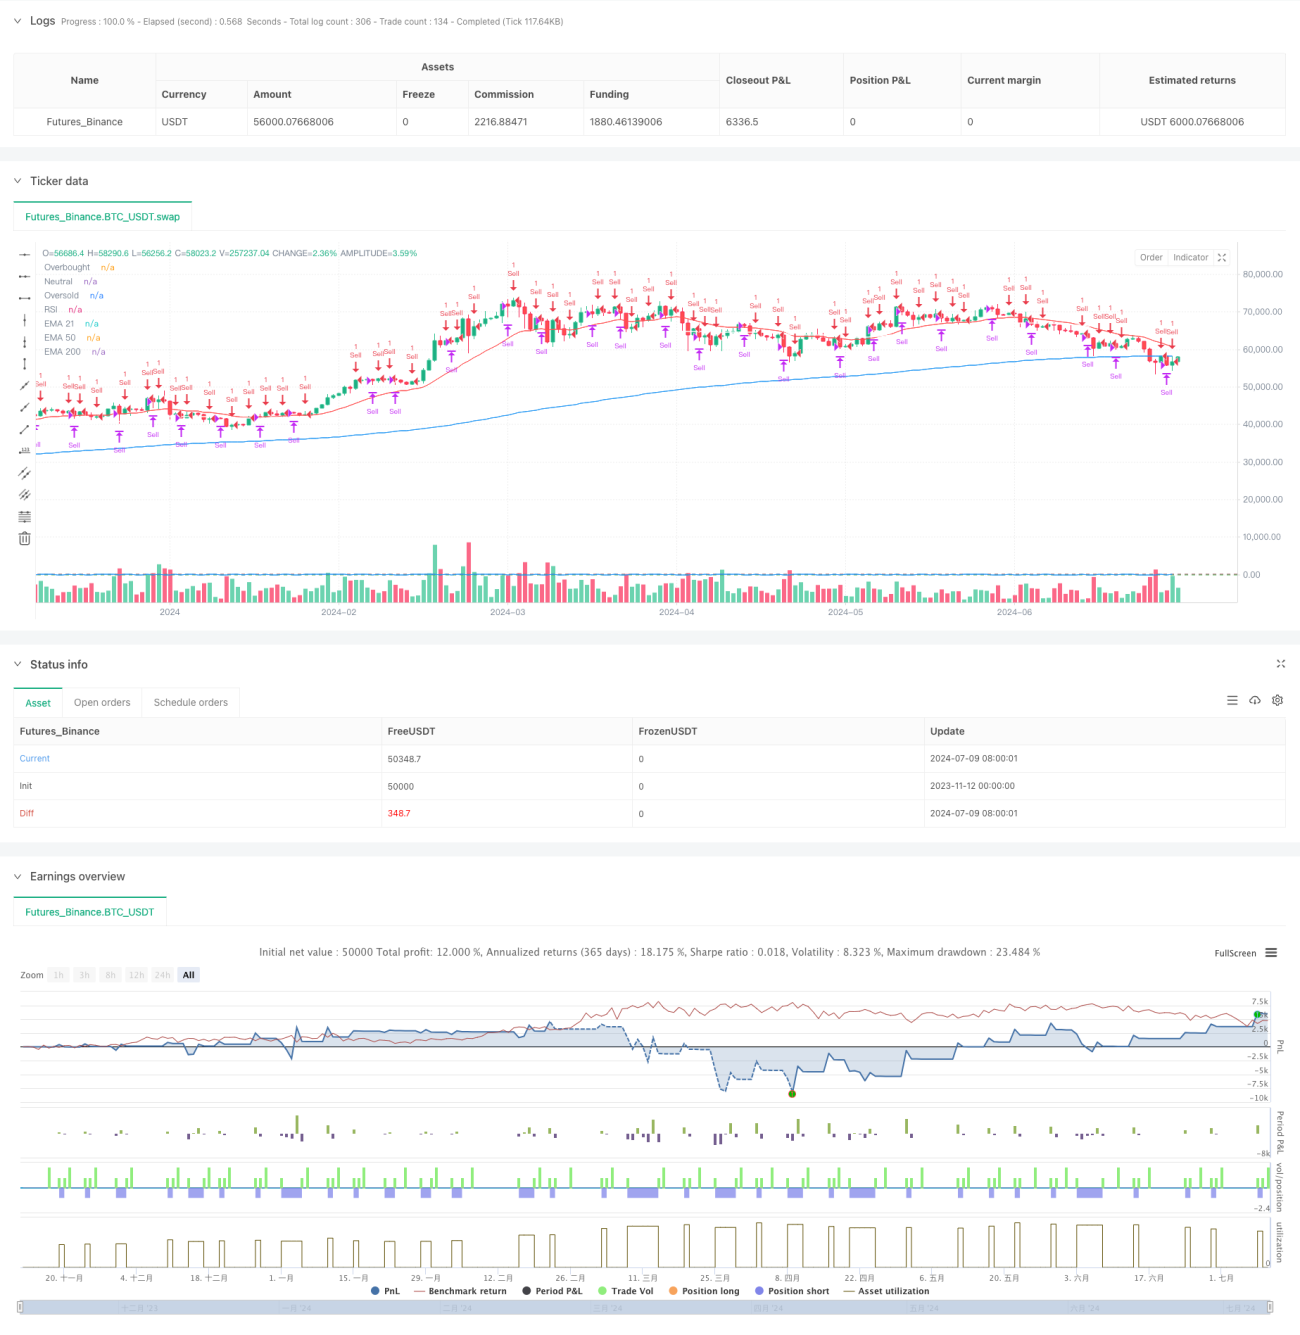
यह रणनीति गतिशीलता संकेतक आरएसआई और रुझान संकेतक ईएमए के संयोजन के साथ एक मिश्रित ट्रेडिंग प्रणाली है। यह 1 मिनट और 5 मिनट के दो समय चक्रों पर चलता है और आरएसआई के ओवरबॉय और ओवरसोल सिग्नल के साथ-साथ ट्रिपल ईएमए के रुझान निर्णय के माध्यम से ट्रेडिंग निर्णय लेता है। रणनीति में ट्रेंड ट्रैकिंग और औसत मूल्य रिटर्न दोनों शामिल हैं, जो विभिन्न बाजार स्थितियों में व्यापार के अवसरों को पकड़ने में सक्षम हैं।
रणनीति सिद्धांत
रणनीति 21/50/200 दिन के ट्रिपल ईएमए को ट्रेंडिंग बेंचमार्क के रूप में उपयोग करती है, जबकि सुधारित आरएसआई (चेबशेव पद्धति का उपयोग करके गणना की जाती है) के साथ बाजार के ओवरबॉय ओवरसोल की स्थिति की पहचान करने के लिए। 1 मिनट की अवधि में, जब आरएसआई 94 को तोड़ता है, तो यह कम हो जाता है, 4 घंटे की स्थिति में गिर जाता है, और आरएसआई 50 पर वापस आ जाता है, तो यह रोक देता है। 5 मिनट की अवधि में, जब कीमत 200 दिन के ईएमए को तोड़ती है और रिबाउंड के लिए खुली होती है, तो यह अधिक हो जाती है।
रणनीतिक लाभ
- मल्टीपल टाइम साइकल एनालिसिस सिग्नल विश्वसनीयता को बढ़ाता है
- प्रवृत्ति और गतिशीलता सूचकांक के संयोजन से लाभ
- जोखिम को नियंत्रित करने के लिए रोकथाम तंत्र
- आरएसआई गणना के लिए एक सुधारित विधि, संकेत अधिक सटीक है
- स्थिति प्रबंधन के माध्यम से दोहराव से बचें
- विभिन्न बाजार स्थितियों के लिए अनुकूल
रणनीतिक जोखिम
- बार-बार लेन-देन करने से शुल्क में वृद्धि हो सकती है
- अत्यधिक उतार-चढ़ाव वाले बाजारों में अक्सर स्टॉप लॉस ट्रिगर किया जा सकता है
- आरएसआई सूचक कुछ बाजार स्थितियों में झूठे संकेत दे सकता है
- बहु-आयामी रणनीति संकेत की पुष्टि में देरी हो सकती है
- EMA क्रॉस सिग्नल बाज़ार में उतार-चढ़ाव के दौरान भ्रामक हो सकता है
रणनीति अनुकूलन दिशा
- उच्च उतार-चढ़ाव के दौरान पैरामीटर को समायोजित करने के लिए एक अस्थिरता फ़िल्टर पेश करें
- लेन-देन की पुष्टि करने के लिए एक और तंत्र
- आरएसआई थ्रेशोल्ड को अनुकूलित करें, गतिशील समायोजन पर विचार करें
- क्रॉस-सत्यापन के लिए अधिक तकनीकी संकेतक जोड़ें
- अनुकूली पैरामीटर तंत्र का परिचय
- अधिक परिष्कृत रोकथाम तंत्र
संक्षेप
रणनीति कई तकनीकी संकेतकों और कई समय चक्र विश्लेषण के संयोजन के माध्यम से व्यापार की स्थिरता और विश्वसनीयता में सुधार करती है। हालांकि कुछ जोखिम मौजूद हैं, उचित स्थिति प्रबंधन और स्टॉपलॉस तंत्र के माध्यम से जोखिम को प्रभावी रूप से नियंत्रित किया जा सकता है। रणनीति के अनुकूलन के लिए जगह बड़ी है, और अधिक तकनीकी संकेतकों और अनुकूलन मापदंडों को पेश करके रणनीति के प्रदर्शन को और बढ़ाया जा सकता है।
- 1