टी 3 मूविंग एवरेज ट्रेंड ट्रैकिंग और मूविंग स्टॉप लॉस क्वांटिटेटिव ट्रेडिंग रणनीति

अवलोकन
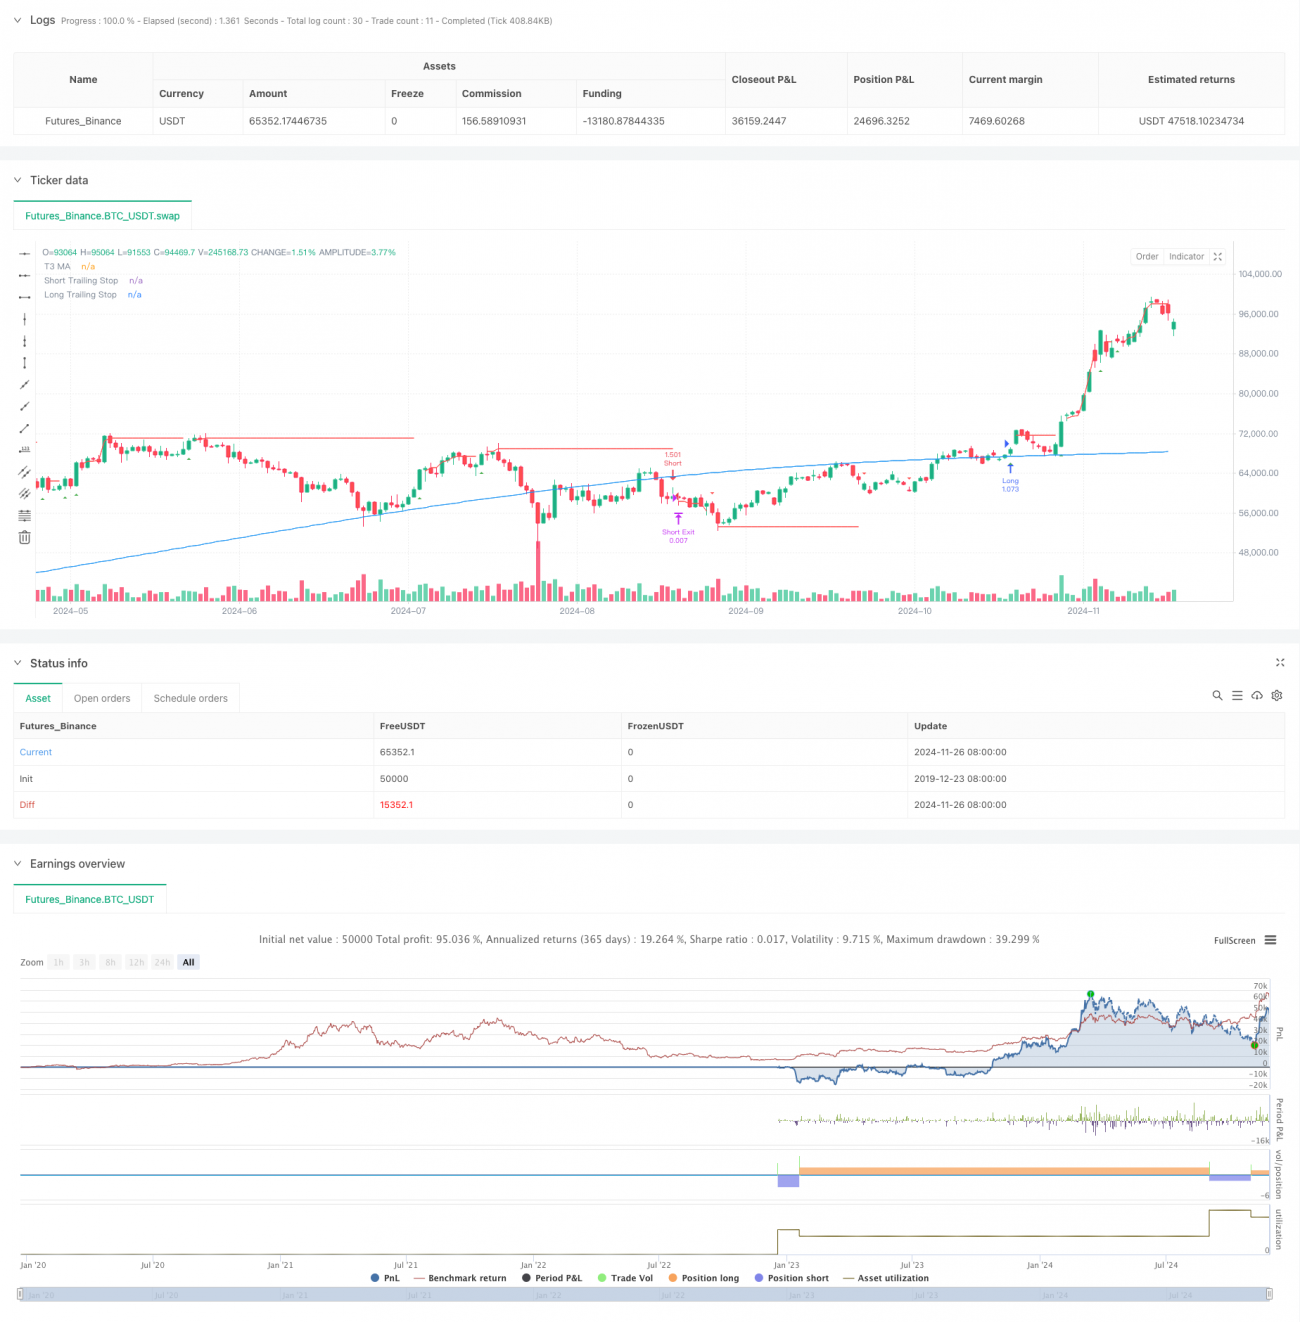
यह रणनीति एक व्यापक मात्रात्मक व्यापार प्रणाली है जो T3 औसत, ट्रेंड ट्रैकिंग और मोबाइल स्टॉप तंत्र को जोड़ती है। रणनीति T3 मोबाइल औसत के माध्यम से बाजार की प्रवृत्ति की दिशा की पहचान करती है, जबकि लेमन ट्रेंड इंडिकेटर और टीडीएफआई इंडिकेटर का उपयोग करके सिग्नल की पुष्टि करती है, और मोबाइल स्टॉप और फिक्स्ड स्टॉप के संयोजन के साथ जोखिम प्रबंधन प्रणाली के साथ मिलकर प्रवृत्ति की समझ और जोखिम के प्रभावी नियंत्रण को प्राप्त करती है।
रणनीति सिद्धांत
इस रणनीति के मूल में तीन मुख्य भाग होते हैंः प्रवृत्ति पहचान, संकेत की पुष्टि और जोखिम प्रबंधन। सबसे पहले, T3 चलती औसत का उपयोग मुख्य प्रवृत्ति पहचान उपकरण के रूप में किया जाता है, T3 औसत को छठे सूचकांक के माध्यम से चलती औसत की गणना के माध्यम से किया जाता है, जो प्रभावी रूप से विलंबता को कम करने और चिकनाई को बनाए रखने में सक्षम है। दूसरा, लेमन ट्रेंड इंडिकेटर के माध्यम से कीमतों के उतार-चढ़ाव की सीमा की गणना की जाती है, टीडीएफआई इंडिकेटर के साथ संयोजन में सिग्नल फ़िल्टर किया जाता है, और केवल तभी ट्रेड सिग्नल उत्पन्न होता है जब कीमतें उतार-चढ़ाव की सीमा को तोड़ती हैं और टीडीएफआई इंडिकेटर की पुष्टि होती है। अंत में, रणनीति को एक संयोजन के रूप में ले जाती है। जोखिम प्रबंधन, जिसमें एक चलती स्टॉप और एक फिक्स्ड स्टॉप शामिल हैं, जो कीमतों के सक्रिय स्तर तक पहुंचने के बाद चलती स्टॉप को ट्रैक करना शुरू करते हैं, जबकि एक सुरक्षा तंत्र के रूप में एक फिक्स्ड स्टॉप को बनाए रखते हैं।
रणनीतिक लाभ
- बहु सिग्नल पुष्टिकरण तंत्र लेनदेन सटीकता में सुधार करता है
- T3 औसत रेखा के उपयोग से झूठी दरारें कम हो जाती हैं
- एक लचीली जोखिम प्रबंधन प्रणाली जो लाभ की रक्षा करते हुए रुझानों को पर्याप्त जगह देती है
- लाभ के चरणबद्ध भुगतान के लिए आंशिक स्थिति बंद करने का समर्थन करें
- विभिन्न बाजार स्थितियों के अनुसार अनुकूलन के लिए समायोज्य पैरामीटर
रणनीतिक जोखिम
- T3 औसत गणना जटिल है, गणना में देरी हो सकती है
- मल्टी सिग्नल कन्फर्मेशन के कारण कुछ ट्रेडिंग अवसरों को याद किया जा सकता है
- मोबाइल स्टॉप लॉस को तीव्र उतार-चढ़ाव के दौरान जल्दी से ट्रिगर किया जा सकता है
- प्रभावी संकेतों के लिए अधिक मूल्य उतार-चढ़ाव की आवश्यकता होती है
- बाज़ार में लगातार गलत संकेत
रणनीति अनुकूलन दिशा
- अस्थिरता दर सूचक को लागू करने के लिए गतिशील रोक-हट पैरामीटर को समायोजित करें
- विभिन्न बाजार स्थितियों के लिए विभिन्न मापदंडों का उपयोग करने के लिए बाजार परिवेश पहचान मॉड्यूल जोड़ा गया
- टीडीएफआई सूचक के लिए गणना चक्र का अनुकूलन, सिग्नल की समयबद्धता में सुधार
- सिग्नल पुष्टिकरण के लिए लेनदेन कारक जोड़ने पर विचार करें
- स्व-अनुकूलीकरण के लिए आंशिक रोक अनुपात सेटिंग तंत्र का अध्ययन
संक्षेप
यह एक व्यापक प्रवृत्ति ट्रैकिंग रणनीति है, जो कई तकनीकी संकेतकों के सह-उपयोग के माध्यम से व्यापारिक संकेतों की विश्वसनीयता की गारंटी देता है और प्रभावी जोखिम प्रबंधन को लागू करता है। रणनीति का मॉड्यूलर डिजाइन इसे अच्छी स्केलेबिलिटी और अनुकूलन के लिए जगह देता है, जो मध्यम और दीर्घकालिक प्रवृत्ति ट्रैकिंग सिस्टम के लिए एक बुनियादी ढांचे के रूप में उपयुक्त है। व्यावहारिक अनुप्रयोगों में, विशिष्ट व्यापारिक किस्मों और बाजार की स्थिति के अनुसार पैरामीटर के अनुकूलन को अनुकूलित करने की सिफारिश की जाती है।
/*backtest
start: 2019-12-23 08:00:00
end: 2024-11-27 00:00:00
period: 1d
basePeriod: 1d
exchanges: [{"eid":"Futures_Binance","currency":"BTC_USDT"}]
*/

//@version=5
strategy("Lemon Trend Strategy", overlay=true, initial_capital=10000, default_qty_type=strategy.percent_of_equity, default_qty_value=100)

// Input parameters- 1