डुअल चेन हाइब्रिड मोमेंटम मूविंग एवरेज फॉलोइंग ट्रेडिंग सिस्टम

अवलोकन
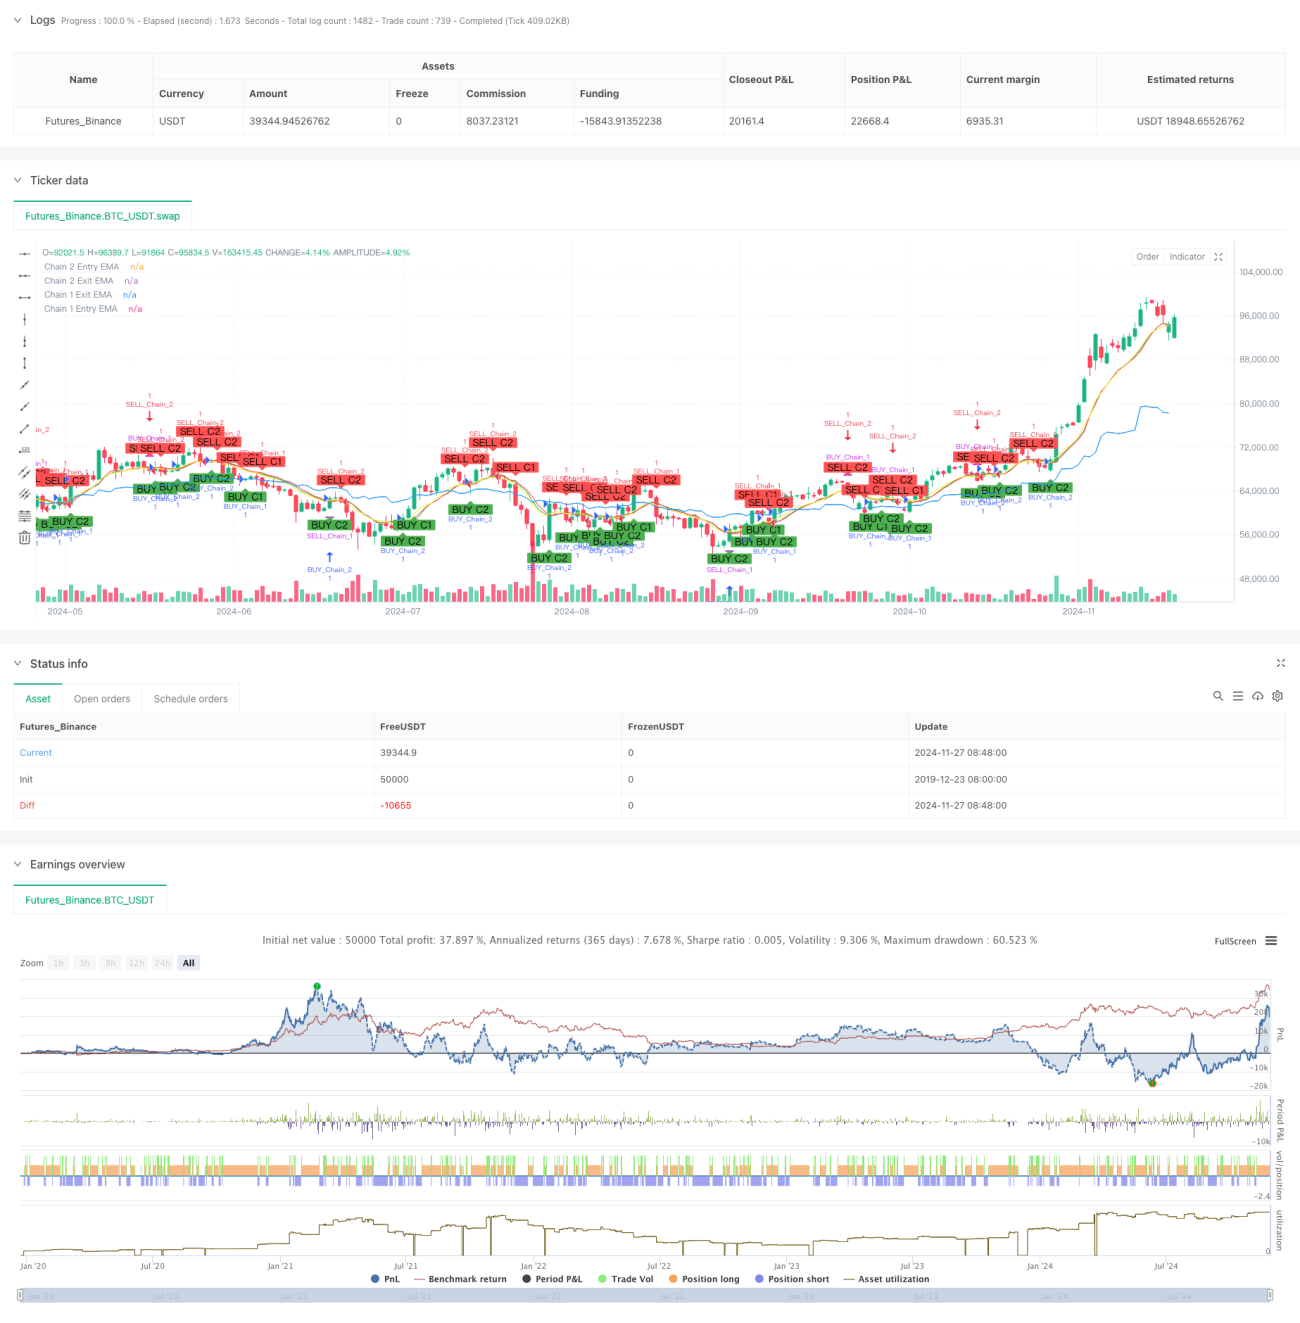
यह रणनीति सूचकांक चलती औसत (ईएमए) पर आधारित एक अभिनव ट्रेडिंग प्रणाली है जो विभिन्न समय चक्रों में दो स्वतंत्र ट्रेडिंग श्रृंखलाओं को स्थापित करके बाजार के अवसरों को पकड़ने के लिए है। रणनीति लंबी अवधि के रुझानों को ट्रैक करने और अल्पकालिक गतिशीलता ट्रेडिंग के लाभों को एकीकृत करती है, और व्यापार संकेतों को उत्पन्न करने के लिए सप्ताह, दिन, 12 घंटे और 9 घंटे जैसे कई समय चक्रों पर ईएमए के क्रॉसिंग के माध्यम से बाजार के बहुआयामी विश्लेषण और समझ को प्राप्त करती है।
रणनीति सिद्धांत
रणनीति एक दोहरी श्रृंखला डिजाइन है, प्रत्येक श्रृंखला में एक अद्वितीय प्रवेश और निकास तर्क हैः
श्रृंखला 1 (दीर्घकालिक रुझान) में परिधि रेखा और दिन रेखा चक्र का उपयोग किया गया हैः
- प्रवेश सिग्नलः जब समापन मूल्य ईएमए को परिपत्र चक्र पर पार करता है तो एक बहु सिग्नल उत्पन्न होता है
- आउटपुट सिग्नलः जब क्लोज-आउट कीमतें ईएमए को पार करती हैं, तो एक क्लोज-आउट सिग्नल उत्पन्न होता है
- डिफ़ॉल्ट ईएमए चक्र 10 है, जिसे आवश्यकता के अनुसार समायोजित किया जा सकता है
श्रृंखला 2 (अल्पकालिक गतिशीलता) 12 घंटे और 9 घंटे के चक्र का उपयोग करता हैः
- प्रवेश सिग्नलः 12 घंटे की अवधि में ईएमए को पार करने के लिए क्लोज-आउट सिग्नल उत्पन्न होता है
- एग्जिट सिग्नलः जब क्लोज-आउट कीमत 9 घंटे के चक्र पर ईएमए को पार करती है तो एक ब्रीज सिग्नल उत्पन्न होता है
- डिफ़ॉल्ट ईएमए चक्र 9 है, जिसे आवश्यकतानुसार समायोजित किया जा सकता है
रणनीतिक लाभ
- बहुआयामी बाजार विश्लेषणः विभिन्न समय चक्रों के संयोजन के माध्यम से बाजार की गति को पूरी तरह से समझें
- लचीलापनः दो श्रृंखलाओं को अलग-अलग ट्रेडिंग शैलियों के लिए स्वतंत्र रूप से चालू या बंद किया जा सकता है
- जोखिम नियंत्रण में सुधारः कई समय चक्रों की पुष्टि के साथ, झूठे संकेतों के जोखिम को कम करना
- पैरामीटर समायोज्यः ईएमए चक्र और समय चक्र दोनों को आवश्यकता के अनुसार संशोधित किया जा सकता है
- बेहतर फीडबैकः अंतर्निहित फीडबैक के दौरान सेटिंग्स, नीति सत्यापन और अनुकूलन के लिए
रणनीतिक जोखिम
- रुझान में बदलाव का खतराः बाजार में भारी उतार-चढ़ाव के कारण मंदी का खतरा
- समय चक्र विन्यास जोखिमः विभिन्न बाजारों में अलग-अलग समय चक्र संयोजन की आवश्यकता हो सकती है
- पैरामीटर अनुकूलन जोखिमः अत्यधिक अनुकूलन से अति-अनुकूलन हो सकता है
- सिग्नल ओवरलैप जोखिमः दो श्रृंखलाओं को एक साथ ट्रिगर करने से स्थिति का जोखिम बढ़ सकता है
जोखिम नियंत्रण सुझाव:
- उचित स्टॉप लॉस सेट करें
- बाजार विशेषताओं के अनुसार पैरामीटर को समायोजित करना
- पूर्ण फीडबैक और सत्यापन
- प्रत्येक लेनदेन के लिए पूंजी अनुपात को नियंत्रित करें
रणनीति अनुकूलन दिशा
- सिग्नल फ़िल्टरिंग अनुकूलन:
- वॉल्यूम पुष्टिकरण तंत्र जोड़ें
- अस्थिरता सूचक फ़िल्टर सिग्नल का परिचय
- बढ़ते रुझान की पुष्टि
- जोखिम नियंत्रण अनुकूलन:
- गतिशील स्टॉप लॉस तंत्र विकसित करना
- स्टॉक प्रबंधन प्रणाली डिजाइन करें
- वापस लेने के लिए नियंत्रण जोड़ें
- समय चक्र अनुकूलन:
- इष्टतम समय चक्र संयोजन का अध्ययन करें
- अनुकूलन समय चक्र तंत्र विकसित करना
- बाजार की स्थिति की पहचान करने के लिए जोड़ें
संक्षेप
डबल चेन मिश्रित मात्रा और औसत रेखा ट्रेडिंग सिस्टम, बाजार के बहु-आयामी विश्लेषण और समझ को लंबे समय तक और अल्पकालिक औसत रेखा रणनीति के साथ अभिनव रूप से जोड़कर प्राप्त करता है। सिस्टम डिजाइन लचीला है, इसे विभिन्न बाजार स्थितियों और व्यापारी शैली के अनुसार समायोजित किया जा सकता है, और इसकी मजबूत व्यावहारिकता है। उचित जोखिम नियंत्रण और निरंतर अनुकूलन के माध्यम से, रणनीति को वास्तविक व्यापार में स्थिर रिटर्न प्राप्त करने की उम्मीद है। व्यापारियों को सलाह दी जाती है कि वे वास्तविक उपयोग से पहले पर्याप्त रूप से परीक्षण और पैरामीटर अनुकूलन करें ताकि सर्वोत्तम व्यापार प्रभाव प्राप्त हो सके।
- 1