अवलोकन
रणनीति एक बहुआयामी ट्रेडिंग निर्णय तंत्र को लागू करती है, जिसमें द्वि-समान रेखा प्रणाली, अपेक्षाकृत मजबूत-कमजोर सूचक (आरएसआई) और अपेक्षाकृत मजबूत (आरएसआई) विश्लेषण शामिल हैं। रणनीति 13 वीं और 21 वीं सूचकांक चलती औसत (ईएमए) की क्रॉस-पुष्टिकरण प्रवृत्ति के माध्यम से, आरएसआई और आधार सूचकांक के आरएस मूल्य के संबंध में ट्रेडिंग सिग्नल की पुष्टि के साथ-साथ बहुआयामी ट्रेडिंग निर्णय तंत्र को लागू करती है। रणनीति में 52 सप्ताह की ऊंचाई और फिर से प्रवेश की शर्तों के आधार पर जोखिम नियंत्रण तंत्र और निर्णय शामिल हैं।
रणनीति सिद्धांत
इस रणनीति में कई संकेतों की पुष्टि की जाती है:
- इनपुट सिग्नल को निम्नलिखित शर्तों को पूरा करना होगा:
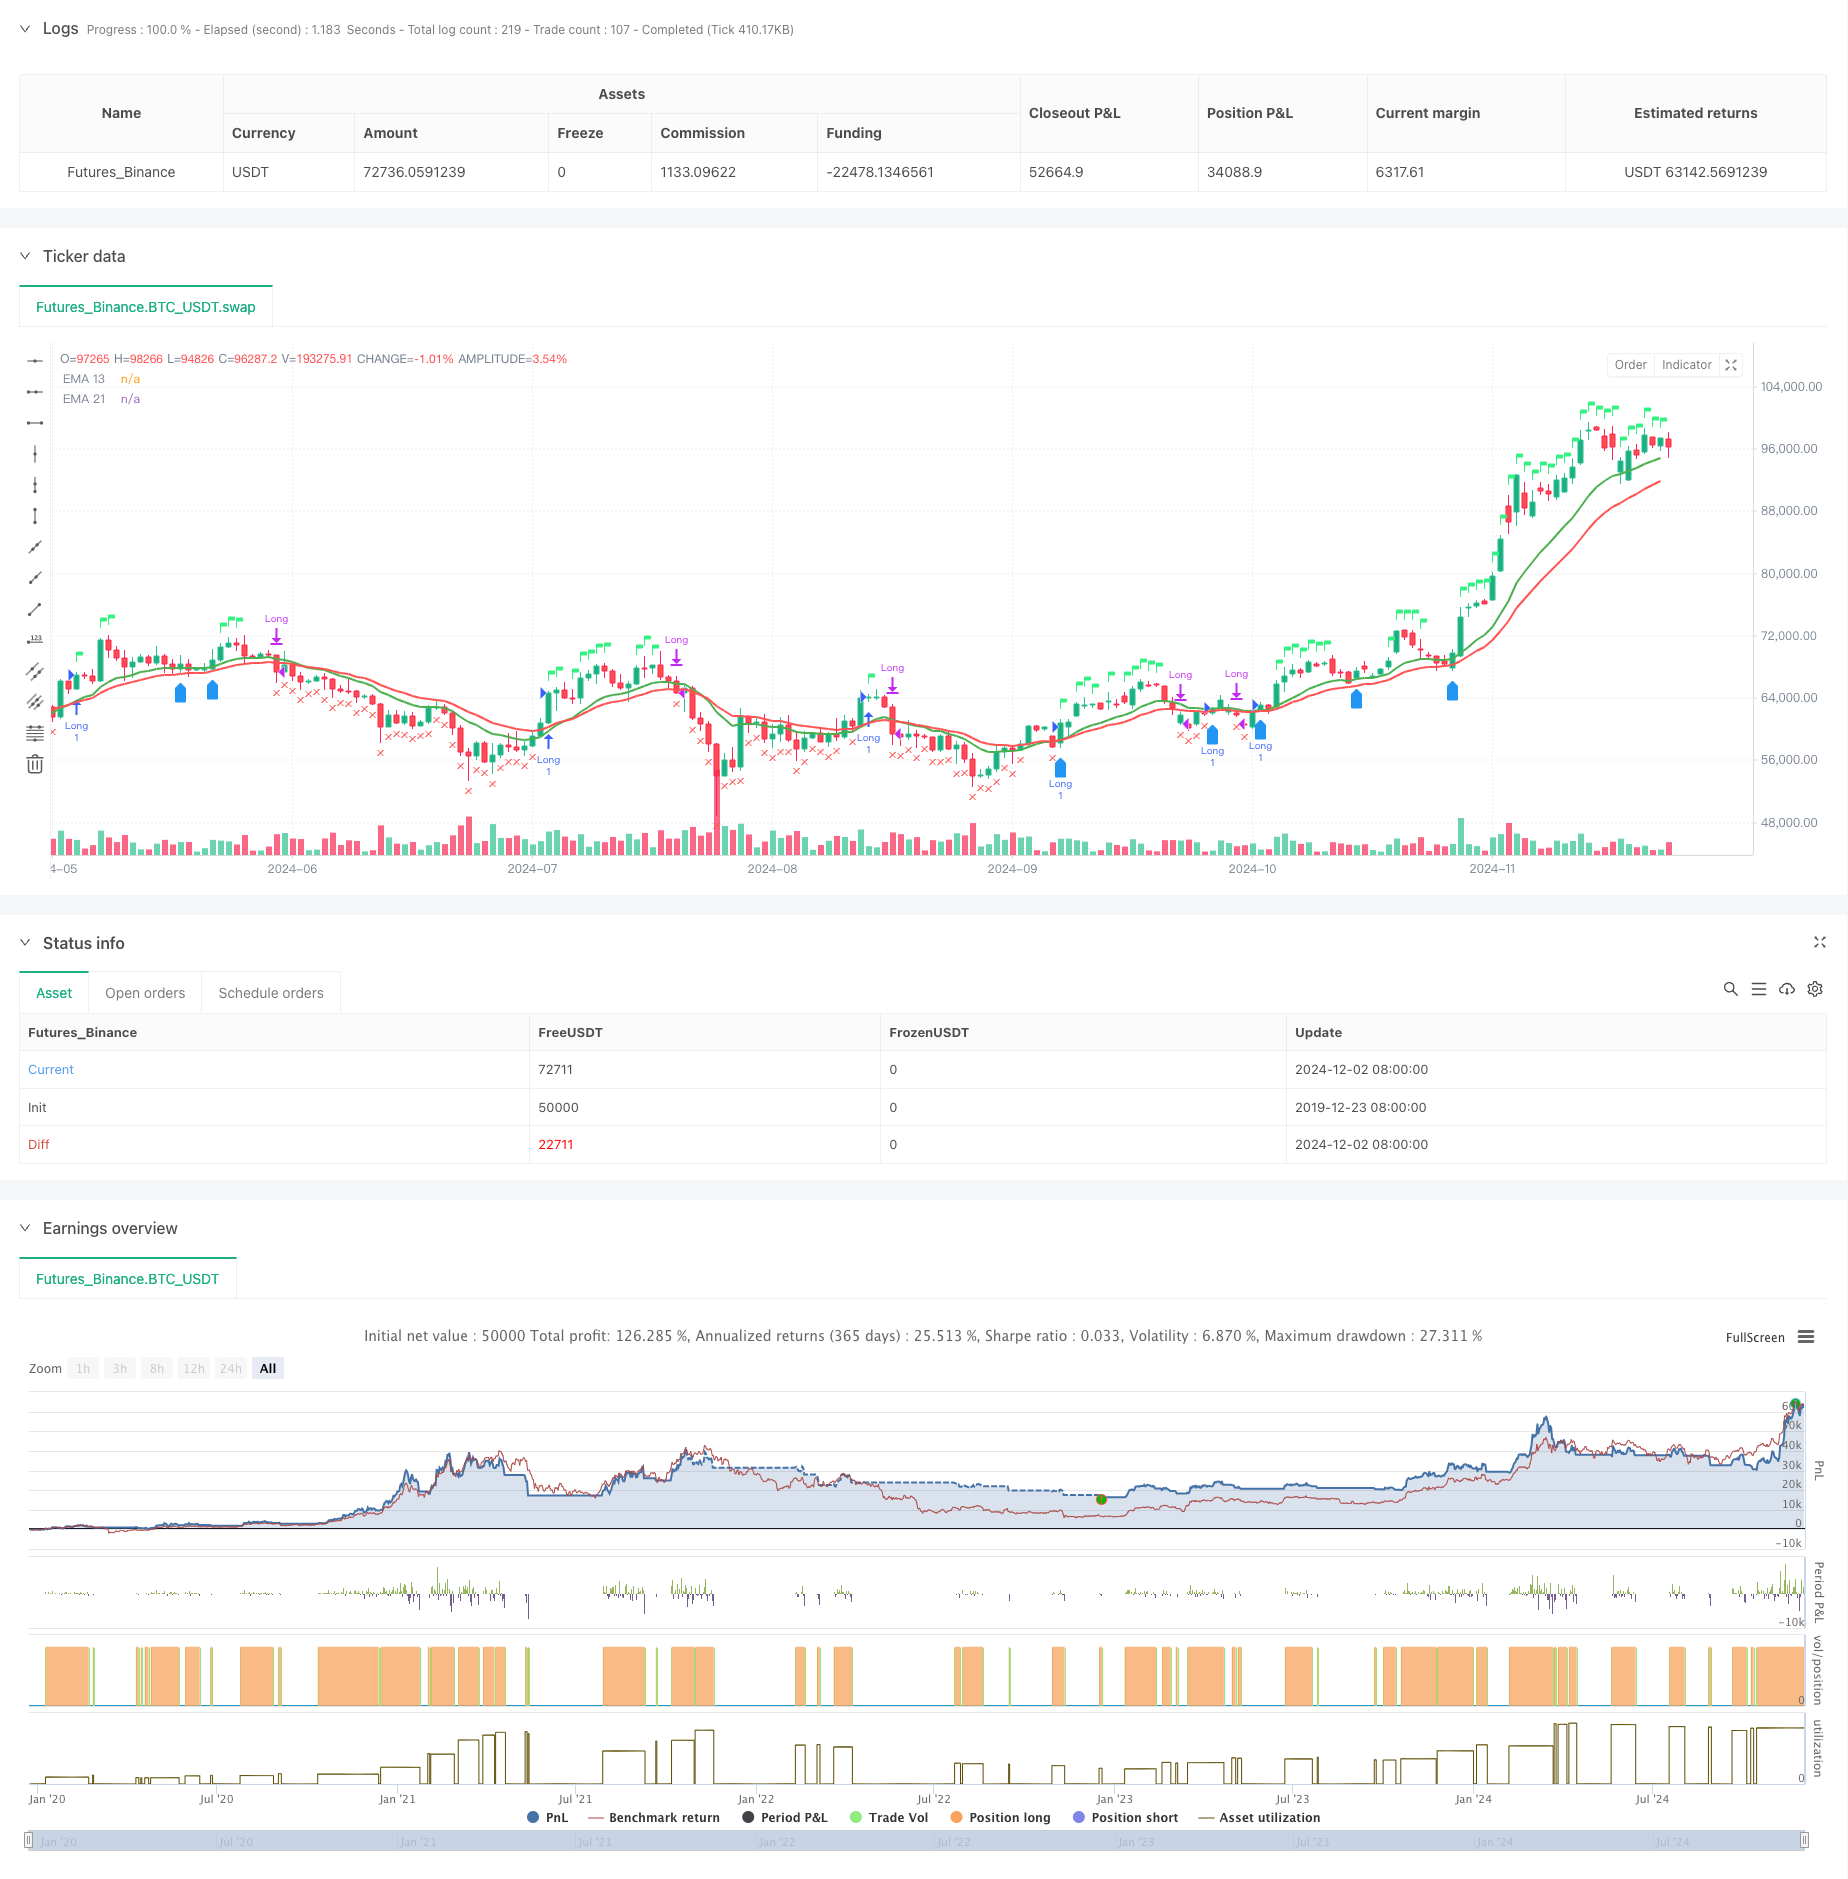
- ईएमए 13 पर ईएमए 21 पहनें या ईएमए 13 से अधिक कीमत
- RSI 60 से अधिक
- सापेक्ष तीव्रता ((RS) के रूप में सकारात्मक
- बाहर निकलने की शर्तों में शामिल हैंः
- ईएमए 21 से नीचे
- RSI 50 से नीचे
- आरएस नकारात्मक करने के लिए
- फिर से प्रवेश के लिए शर्तेंः
- ईएमए 13 की कीमत और ईएमए 13 ईएमए 21 से बड़ा है
- आरएस के रूप में सकारात्मक रखा
- या पिछले सप्ताह के उच्चतम स्तर को पार कर गया
रणनीतिक लाभ
- मल्टी सिग्नल पुष्टिकरण तंत्र ने झूठी घुसपैठ के जोखिम को कम किया
- तुलनात्मक ताकत विश्लेषण के साथ, मजबूत किस्मों को प्रभावी ढंग से छानना
- अनुकूलित समय चक्र समायोजन तंत्र
- अच्छी तरह से नियंत्रित जोखिम प्रणाली
- एक बुद्धिमान पुनः प्रवेश तंत्र
- वास्तविक समय लेन-देन की स्थिति को प्रदर्शित करता है
रणनीतिक जोखिम
- बाज़ार में उतार-चढ़ाव से बार-बार लेन-देन हो सकता है
- कई सूचकांकों पर निर्भरता सिग्नल विलंब का कारण बन सकती है
- फिक्स्ड आरएसआई थ्रेसहोल्ड सभी बाजार स्थितियों के लिए उपयुक्त नहीं हो सकता है
- सापेक्ष शक्ति की गणना बेन्चमार्क सूचकांक की सटीकता पर निर्भर है
- 52-सप्ताह के उच्चतम स्तर पर स्टॉप लॉस बहुत कम हो सकता है
रणनीति अनुकूलन दिशा
- अनुकूलित आरएसआई थ्रेशोल्ड
- पुनः प्रवेश की शर्तों के लिए निर्णय तर्क का अनुकूलन
- लेन-देन की मात्रा विश्लेषण आयाम बढ़ाएं
- स्टॉप-प्रॉफिट और स्टॉप-लॉस तंत्र में सुधार करें
- आवृत्ति फ़िल्टर जोड़ें
- अनुकूलन सापेक्ष तीव्रता गणना चक्र
संक्षेप
रणनीति तकनीकी विश्लेषण और सापेक्ष शक्ति विश्लेषण के संयोजन के माध्यम से एक व्यापक व्यापार प्रणाली का निर्माण करती है। इसकी कई सिग्नल पुष्टिकरण तंत्र और जोखिम नियंत्रण प्रणाली इसे एक मजबूत व्यावहारिकता प्रदान करती है। अनुशंसित अनुकूलन दिशाओं के माध्यम से, रणनीति में और अधिक उन्नयन के लिए जगह है। रणनीति के सफल कार्यान्वयन के लिए एक व्यापारी को बाजार की गहरी समझ की आवश्यकता होती है और विशिष्ट व्यापारिक किस्मों की विशेषताओं के अनुसार उचित पैरामीटर समायोजन की आवश्यकता होती है।
/*backtest
start: 2019-12-23 08:00:00
end: 2024-12-03 00:00:00
period: 1d
basePeriod: 1d
exchanges: [{"eid":"Futures_Binance","currency":"BTC_USDT"}]
*/

//@version=5
strategy("EMA 13 & 21 Entry Exit", overlay=true)

// Define the EMAs
ema13 = ta.ema(close, 13)
ema21 = ta.ema(close, 21)

// Define the RSI
rsi = ta.rsi(close, 14)

// Calculate the closing price relative to Nifty 50
//nifty50 = request.security("NSE:NIFTY", timeframe.period, close)
//closeRelative = close / nifty50

// Define a base period (e.g., 123) and adjust it based on the timeframe
//basePeriod = 123

// Calculate the effective period based on the timeframe
//effectivePeriod = basePeriod * (timeframe.isintraday ? (60 / timeframe.multiplier) : 1)

// Calculate the EMA
//rs = ta.ema(closeRelative, effectivePeriod)

// Define the Relative Strength with respect to NIFTY 50
nifty50 = request.security("swap", "D", close)
rs = ta.ema(close / nifty50, 55 )

// Define the previous 2-week low and last week's high
twoWeekLow = ta.lowest(low, 10)  // 10 trading days roughly equal to 2 weeks
lastWeekHigh = ta.highest(high, 5)  // 5 trading days roughly equal to 1 week
fiftytwoWeekhigh = ta.highest(high, 52*5) // 252 tradingdays roughly equal to 52 week.

// Long condition: EMA 21 crossing above EMA 55, price above EMA 21, RSI > 50, and RS > 0
longCondition = ta.crossover(ema13, ema21) or close > ema13 and rsi > 60 and rs > 0

// Exit condition: Price closing below EMA 55 or below the previous 2-week low
exitCondition = close < ema21 or rsi < 50 or rs < 0 //or close < fiftytwoWeekhigh*0.80

// Re-entry condition: Price crossing above EMA 21 after an exit, EMA 21 > EMA 55, and RS > 1
reEntryCondition = ta.crossover(close, ema13) and ema13 > ema21 and rs > 0

// Re-entry condition if trailing stop loss is hit: Price crossing above last week's high
reEntryAfterSL = ta.crossover(close, lastWeekHigh)

// Plot the EMAs
plot(ema13 ,color=color.green, title="EMA 13",linewidth = 2)
plot(ema21, color=color.red, title="EMA 21",linewidth = 2)


// Plot buy and sell signals
plotshape(series=longCondition, location=location.abovebar, color=color.rgb(50, 243, 130), style=shape.flag, title="Buy Signal")
plotshape(series=exitCondition, location=location.belowbar, color=color.red, style=shape.xcross, title="Sell Signal")
plotshape(series=reEntryCondition or reEntryAfterSL, location=location.belowbar, color=color.blue, style=shape.labelup, title="Re-entry Signal")
//plotshape(series = fiftytwoWeekhigh,location=location.abovebar, color=color.blue,style=shape.flag, title="52WH")

// Plot background color for RS > 0
//bgcolor(rs > 0 ? color.new(color.green, 90) : na, title="RS Positive Background")
// Plot the previous 2-week low and last week's high
// plot(twoWeekLow, color=color.orange, title="2-Week Low")
// plot(lastWeekHigh, color=color.purple, title="Last Week High")

// Strategy logic
if (longCondition or reEntryCondition or reEntryAfterSL)
    strategy.entry("Long", strategy.long)

if (exitCondition)
    strategy.close("Long")

 // Calculate Stop Loss (SL) and Profit
var float entryPrice = na
var float stopLoss = na
var float profit = na

if (strategy.opentrades > 0)
    entryPrice := strategy.opentrades.entry_price(strategy.opentrades - 1)
    stopLoss := fiftytwoWeekhigh * 0.80
    profit := (close - entryPrice) / entryPrice * 100

// Display the strategy table
var table strategyTable = table.new(position.top_right, 4, 2, border_width = 1)

// Make the table movable
tableX = input.int(0, title="Table X Position")
tableY = input.int(0, title="Table Y Position")

// Add size options for the table
tableSize = input.string("small", title="Table Size", options=["tiny", "small", "large"])

// Adjust table size based on user input
tableWidth = tableSize == "tiny" ? 2 : tableSize == "small" ? 4 : 6
tableHeight = tableSize == "tiny" ? 1 : tableSize == "small" ? 2 : 3

// Create the table with the specified size
//table = table.new(position.top_right, tableWidth, tableHeight, border_width = 1)

// Position the table based on user input
// table.cell(strategyTable, tableX, tableY, "Entry Price",  bgcolor=#18eef9)
// table.cell(strategyTable, tableX, tableY + 1, str.tostring(entryPrice, format.mintick), bgcolor=#18eef9)
// table.cell(strategyTable, tableX + 1, tableY, "Stop Loss (20%)", bgcolor=color.red)
// table.cell(strategyTable, tableX + 1, tableY + 1, str.tostring(stopLoss, format.mintick), bgcolor=color.red)
// table.cell(strategyTable, tableX + 2, tableY, "Profit (%)", bgcolor=color.green)
// table.cell(strategyTable, tableX + 2, tableY + 1, str.tostring(profit, format.percent), bgcolor=color.green)