
अवलोकन
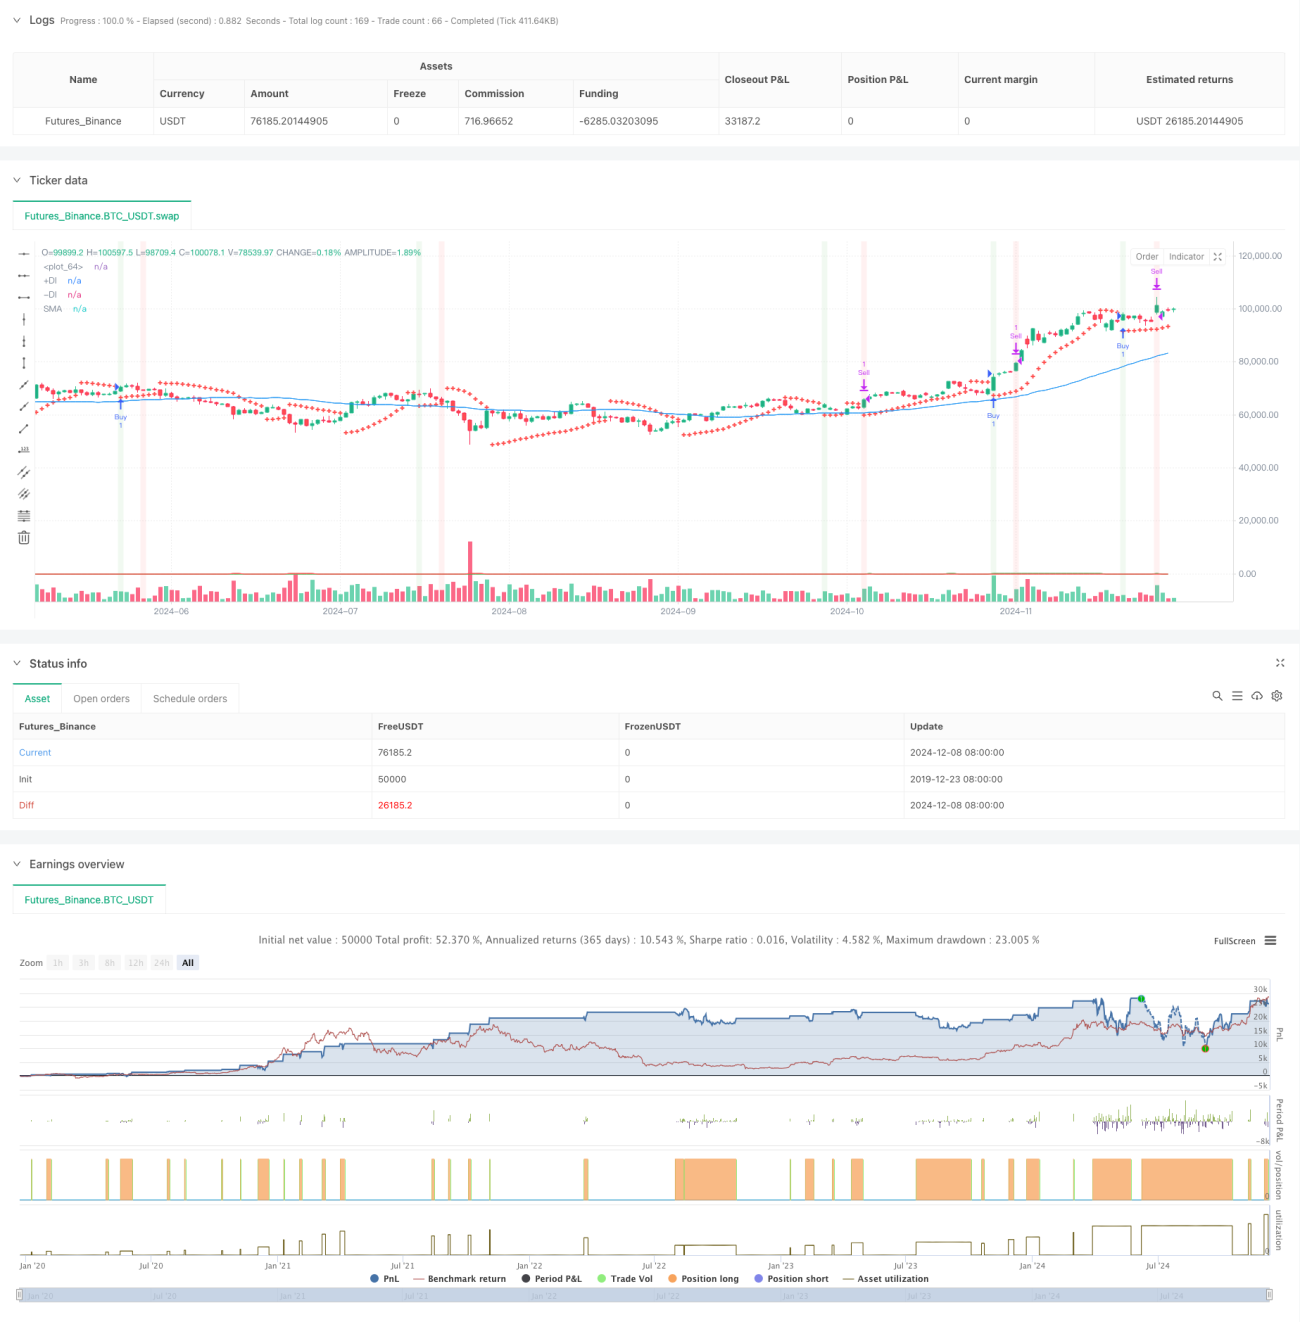
रणनीति एक प्रवृत्ति ट्रैकिंग ट्रेडिंग प्रणाली है जो कई तकनीकी संकेतकों को जोड़ती है। यह मुख्य रूप से बाजार की प्रवृत्ति और प्रवेश के समय को निर्धारित करने के लिए पारलौकिक रूपरेखा (SAR), चलती औसत (SMA) और दिशात्मक गतिशीलता (DMI) का उपयोग करता है, और प्रतिशत स्टॉप और MACD पीछे हटने के माध्यम से बाहर निकलने का अनुकूलन करता है। रणनीति के डिजाइन का मुख्य विचार एक मजबूत प्रवृत्ति के बाद प्रवेश की पुष्टि करना है, और पूर्वनिर्धारित लाभ लक्ष्य को पूरा करने या प्रवृत्ति में बदलाव के संकेतों के लिए समय पर बाहर निकलना है।
रणनीति सिद्धांत
ट्रेडिंग सिग्नल की पुष्टि करने के लिए रणनीति में कई स्तरों के फ़िल्टरिंग तंत्र का उपयोग किया जाता हैः
- SAR सूचकांक के क्रॉसिंग के माध्यम से प्रारंभिक ट्रेडिंग सिग्नल को पकड़ना
- 50 चक्र SMA का उपयोग करके समग्र प्रवृत्ति की दिशा का आकलन करें
- प्रवृत्ति की ताकत और दिशा की पुष्टि करने के लिए डीएमआई सूचक का उपयोग करना
- प्रवेश की शर्तों को एक साथ पूरा किया जाना चाहिएः कीमतों पर SAR पहनें, कीमतें SMA के ऊपर हों और डीएमआई एक बहुमुखी प्रवृत्ति दिखाएं
- दोहरे तंत्र का उपयोग करनाः 3% लक्ष्य लाभ या MACD डेड फोर्क सिग्नल का प्रदर्शन करना
- बाजार में उतार-चढ़ाव के संदर्भ में एटीआर सूचकांक
रणनीतिक लाभ
- मल्टी-टेक्निकल इंडिकेटर क्रॉस-वेरिफिकेशन, झूठे संकेतों को कम करने में मदद करता है
- ट्रेंड ट्रैकिंग और गतिशीलता सूचकांक के संयोजन के साथ व्यापार सफलता दर में वृद्धि
- स्थिर लाभप्रदता सुनिश्चित करने के लिए एक निश्चित प्रतिशत रोकथाम रणनीति
- एमएसीडी ने रुझान में बदलाव से बचने के लिए आउट-ऑफ-द-मैकेनिज्म से पीछे हटने का फैसला किया
- विभिन्न बाजार विशेषताओं के आधार पर रणनीति पैरामीटर को लचीले ढंग से समायोजित किया जा सकता है
- एटीआर का उपयोग अस्थिरता की निगरानी के लिए किया जाता है
रणनीतिक जोखिम
- एकाधिक संकेतक सिग्नल में देरी का कारण बन सकते हैं
- फिक्स्ड पर्सेंटेज स्टॉप ट्रेडों के दौरान जल्दी बाहर निकल सकता है
- स्टॉपलॉस के अभाव से जोखिम के द्वार बढ़े
- हो सकता है कि बाज़ार में बहुत अधिक झूठे सिग्नल हों
- डीएमआई संकेतक बाजार में उतार-चढ़ाव के दौरान भ्रामक संकेत दे सकता है
रणनीति अनुकूलन दिशा
- एटीआर-आधारित गतिशील स्टॉप लॉस जैसे अनुकूलन स्टॉप लॉस की शुरूआत
- उच्च अस्थिरता के दौरान होल्डिंग आकार को समायोजित करने के लिए अस्थिरता फ़िल्टर विकसित करना
- MACD मापदंडों को अनुकूलित करें और रुझान मोड़ की सटीकता में सुधार करें
- सिग्नल विश्वसनीयता में सुधार के लिए वॉल्यूम पुष्टिकरण तंत्र जोड़ें
- बाजार में उतार-चढ़ाव के आधार पर लक्ष्य मुनाफे को समायोजित करने के लिए गतिशील रोकथाम तंत्र विकसित करना
संक्षेप
इस रणनीति का निर्माण एक अपेक्षाकृत पूर्ण प्रवृत्ति ट्रैकिंग ट्रेडिंग प्रणाली है, जो कई तकनीकी संकेतकों के साथ काम करती है। इसका लाभ संकेतों की पुष्टि की विश्वसनीयता और जोखिम नियंत्रण की लचीलापन में है। हालांकि कुछ पिछड़े जोखिम हैं, लेकिन पैरामीटर अनुकूलन और गतिशील प्रबंधन तंत्र में शामिल होने के माध्यम से रणनीति का समग्र प्रदर्शन अभी भी बेहतर है। निरंतर अनुकूलन और सुधार के माध्यम से, यह रणनीति एक मजबूत व्यापारिक उपकरण बन सकती है।
- 1